- Home
- /
- Programming
- /
- ODS Reports
- /
- Re: Output "true empty" cell with ODS Excel or ODS Tagsets.ExcelXP
- RSS Feed
- Mark Topic as New
- Mark Topic as Read
- Float this Topic for Current User
- Bookmark
- Subscribe
- Mute
- Printer Friendly Page

- Mark as New
- Bookmark
- Subscribe
- Mute
- RSS Feed
- Permalink
- Report Inappropriate Content
It seems like PROC REPORT can accomplish this:
https://communities.sas.com/t5/ODS-and-Base-Reporting/Empty-fields-in-Excel/td-p/144707

- Mark as New
- Bookmark
- Subscribe
- Mute
- RSS Feed
- Permalink
- Report Inappropriate Content
Yes, I saw that post yesterday. Unfortunately, it's not true. As mentioned in my original post here, Report doesn't fix this either.
I have tried several option missing='' type solutions, I have tried both ODS, I have tried XML,XLS, and XLSX. I have tried tabulate and report.
- Mark as New
- Bookmark
- Subscribe
- Mute
- RSS Feed
- Permalink
- Report Inappropriate Content
You're very correct 😞
I know I've seen it done, but I suspect it was via DDE and I generally wouldn't recommend that.
You can try contacting SAS Tech support to see if they have a better answer, or you could try a custom VBA that would convert blanks to true blanks.
Depending on how far down this road you're going, maybe a custom tagset is also an option.
Or like I mentioned, a redesign of the Excel process to handle 'blank' but not empty cells. In my automation processes I haven't found this to be an issue in terms of creating our graphs or tables in Excel. It's an ugly convoluted process but generates 132 reports in two hours.
http://www.health.alberta.ca/services/PHC-community-profiles.html
Or if Cynthia Zender pipes in, she's the guru for all reporting needs 🙂

- Mark as New
- Bookmark
- Subscribe
- Mute
- RSS Feed
- Permalink
- Report Inappropriate Content
Hi and Thanks for the vote of confidence, Reeza. However, when I take SAS out of the picture and just go to Excel to an empty sheet, if I put a space into a cell, then ISBLANK returns FALSE and if I test a cell into which nothing has been typed, then ISBLANK returns TRUE.
So the challenge with any MISSING= or MISSTEXT= options in TABULATE or any coding in REPORT or with using a FORMAT is that they all place -something- even if the -something- is a blank character (space). I do not know what the Excel representation of "empty" is. I played around with blank and '00'x (which in some databases, considered NULL) but got the same result (FALSE) as shown in the screen shot.
Since I typically do my graphs with ODS GRAPHICS or SAS/GRAPH, it wouldn't occur to me to use Excel for this. ODS Graphics will return gaps for missing values, which is the original reason given for the need to have an isblank=TRUE cell. The BREAK option in SGPLOT inserts a break in the line for missing values, which can be represented as blanks. Here's the code I tried. I did NOT use TAGSETS.EXCELXP since it does not support graphs, (by Microsoft design) -- so I just used ODS EXCEL with SGPLOT.


Here's the code I used:
data test;
input month sales;
datalines;
1 10
2 20
3 30
4 .
5 50
6 60
;
run;

option missing=' ';
%let myWorkLocation = %sysfunc(pathname(work));

ods excel file="&myworkLocation./testnew.xlsx"
    options(sheet_interval="none");

proc tabulate data = test missing;
class month;
var sales;
table (month='')*(sales='' *sum='')/ misstext=' ';
run;

proc sgplot data=test;
  series x=month y=sales / break markers datalabel;
run;
ods excel close;
cynthia
- Mark as New
- Bookmark
- Subscribe
- Mute
- RSS Feed
- Permalink
- Report Inappropriate Content
`Thanks for the reply. SAS Graphs do not have enough control to be considered "presentation quality" in my line of work. It's a fine tool for quick analytics, but it's not good enough for executive reporting.
I'm still certain there's a path here, ODS HTML creates a true empty, so SAS certainly has the ability to do so. Just need to figure out what control handles it.
- Mark as New
- Bookmark
- Subscribe
- Mute
- RSS Feed
- Permalink
- Report Inappropriate Content
GTL doesn't develop graphics that are presentation quality? It's a hell of a lot of work but the quality that I've seen is publication quality at minimum and more than presentation valid to the highest execs. It's harder to use than Excel, but you also have more control especially over automated processes.
What type of graphs are you generating, can you link to a sample?
- Mark as New
- Bookmark
- Subscribe
- Mute
- RSS Feed
- Permalink
- Report Inappropriate Content
- Mark as New
- Bookmark
- Subscribe
- Mute
- RSS Feed
- Permalink
- Report Inappropriate Content
I genuinely am interested in seeing these graphs that cannot be produced.
- Mark as New
- Bookmark
- Subscribe
- Mute
- RSS Feed
- Permalink
- Report Inappropriate Content
- Mark as New
- Bookmark
- Subscribe
- Mute
- RSS Feed
- Permalink
- Report Inappropriate Content
You could generate a graph with fake data but that's fine. It's more of a 'challenge' to me, but there's plenty of that around 😉
I have worked in clinical and financial orgs as well, research required for FDA submission and/or journal publications and all tables/graphs are from SAS.

- Mark as New
- Bookmark
- Subscribe
- Mute
- RSS Feed
- Permalink
- Report Inappropriate Content
@ProcWes wrote:
Yes, that's right, they're not high enough quality to present in my business world. Putting in "a hell of a lot of work" to come out with amateur/clinical looking graphics is not something I am interested in.
I do find that belief interesting as my introduction to Excel graphs was that they were much poorer in quality than what I was generating in SAS before every seeing Excel.
And tedious.
I moved to a shop that used Excel for the graphics. I remember spending several days exporting data, highlighting, moving and then going into the resultant basic graphs to set additional properties. At my previous job i had written programs to provide graphs (at least as good as those for the reports in Excel) that provided diagnostics for literally hundreds of instruments in about 10 times as many charts as that report in Excel. Every single day. And scheduled so they were ready when we came into the office.
I submit the actual difference is familiarity and not quality. Your shop probably has years of accumulated templates or experience working with Excel so you think things get done "better" due to that familiarity.
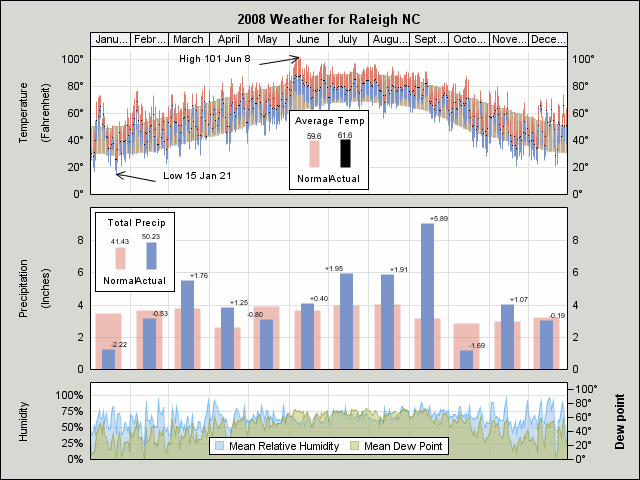
By the way that massive daily graphics process was self-taught in under a year and involved creating a graphic interface to modify the code reading changing instrument installs, with part of the code providing diagnostics to tell when the actual time the instrument package changed in the telemetry. And that was before SAS features that allow creating graphs such as this (which I would have loved to have as I was working with temperature, precipitation, humidy and streamflow data). How long would it take to provide this in Excel? SAS provides example code on there website for this and many other very interesting graphs.
- Mark as New
- Bookmark
- Subscribe
- Mute
- RSS Feed
- Permalink
- Report Inappropriate Content
- Mark as New
- Bookmark
- Subscribe
- Mute
- RSS Feed
- Permalink
- Report Inappropriate Content
@ProcWes wrote:
Thanks for another very unhelpful reply.
You've come on the forum and stated something isn't possible but refuse to explain how or why. That's also unhelpful.
- Mark as New
- Bookmark
- Subscribe
- Mute
- RSS Feed
- Permalink
- Report Inappropriate Content
don't deal with the question and responses that ignore my messages.

- Mark as New
- Bookmark
- Subscribe
- Mute
- RSS Feed
- Permalink
- Report Inappropriate Content
@ProcWes wrote:
I posted a straight forward question. So far, I've gotten responses that
don't deal with the question and responses that ignore my messages.
You raised this quesiton.
Output "true empty" cell with ODS Excel or ODS Tagsets.ExcelXP
The answer is
You cannot curently do that.
You have also received many suggestions for ways to work around this limitation of SAS.

Available on demand!
Missed SAS Innovate Las Vegas? Watch all the action for free! View the keynotes, general sessions and 22 breakouts on demand.
Learn how use the CAT functions in SAS to join values from multiple variables into a single value.

Find more tutorials on the SAS Users YouTube channel.
 Click image to register for webinar
Classroom Training Available!
Select SAS Training centers are offering in-person courses. View upcoming courses for:
-
35 replies
-
08-23-2017 10:18 AM
-
4633 views
-
3 likes
-
5 in conversation
-
