- Home
- /
- Programming
- /
- ODS Reports
- /
- Displaying three SGPLOTS in a single frame
- RSS Feed
- Mark Topic as New
- Mark Topic as Read
- Float this Topic for Current User
- Bookmark
- Subscribe
- Mute
- Printer Friendly Page
- Mark as New
- Bookmark
- Subscribe
- Mute
- RSS Feed
- Permalink
- Report Inappropriate Content
Hi Community,
I'm running SAS 9.2, and I'm trying to display three different graphs horizontally, each of them from a different data set.
The code is this:
proc sgplot data=output_E;
series x=ORDEN_E y=E / lineattrs=(color=blue);
run;

proc sgplot data=output_M;
series x=maturity y=M / lineattrs=(color=red);
run;

proc sgplot data=output_V;
series x=ORDEN_V y=V / lineattrs=(color=green);
run;
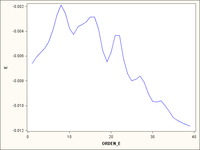
And the output I get is this:
What I want is to display it like this:
I'm modifying the linear drift of each plot simultaneously, so that's why I want to see them in the same line, in order to compare how changes in the linear drift affects the series.
Thank you very much for your help!
Accepted Solutions
- Mark as New
- Bookmark
- Subscribe
- Mute
- RSS Feed
- Permalink
- Report Inappropriate Content
Yes, maybe your version then. What do you mean by " in the SAS Report format"? Do you mean the output window? If so then your not likely to get it there. The output window is a very basic output system - has only just moved to HTML to get any kind of formatting at all. Its not the place to be creating proper reports. To get full functionality output to a file, one of the many types.
What you could try is putting your three datasets together, with a column for the differentiation, and then proc sgpanel'ing them:
data want;
  set output_e (in=a rename=(orden_e=x e_original=y))
       output_m (in=b rename=...)
       output_v (in=c rename=...);
  if a then group="Abc";
  else if b then group="Def";
  else group="Ghi";
run;

proc sgpanel data=want;
  panelby group;
  series x=x y=y;
run;
Oh, and move up to 9.4, many good things extra!
- Mark as New
- Bookmark
- Subscribe
- Mute
- RSS Feed
- Permalink
- Report Inappropriate Content
- Mark as New
- Bookmark
- Subscribe
- Mute
- RSS Feed
- Permalink
- Report Inappropriate Content
Hi RW9,
First of all, thank you for your fast response.
I have been trying both options you suggested with no success...
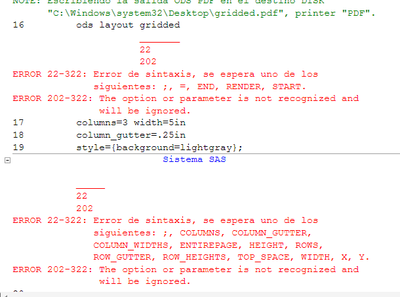
For some reason the option gridded in the ods layout statement doesn't work for me (I don't know if it is a problem of the SAS version [9.2] or the package required for the statement, for example I have not the IML package). I'm trying to run the code:
ods pdf file='Desktop\gridded.pdf';
ods layout gridded
columns=3 width=5in
column_gutter=.25in
style={background=lightgray};

ods region;
proc sgplot data=output_E;
series x=ORDEN_E y=E_original / lineattrs=(color=blue);
run;

ods region;
proc sgplot data=output_M;
series x=maturity y=M_original / lineattrs=(color=red);
run;

ods region;
proc sgplot data=output_V;
series x=ORDEN_V y=V_original / lineattrs=(color=green);
run;

ods layout end;
ods pdf close;
And I get several errors when trying:
I'm sorry about the mix of spanish and english in the log, hope they have fixed that in posterior SAS versions.
Another point is that I would like to do this in the SAS Report format, because I don't need to create a file for the results.
The greplay statement seems to have the same issue, that an output pdf file is required in order to show the results... I have tried to do it that way and I managed to show 6 graphs in 3 columns and 2 rows, but it is not very practical for my purpose...
Anyway, thank you very much for your response!
- Mark as New
- Bookmark
- Subscribe
- Mute
- RSS Feed
- Permalink
- Report Inappropriate Content
Yes, maybe your version then. What do you mean by " in the SAS Report format"? Do you mean the output window? If so then your not likely to get it there. The output window is a very basic output system - has only just moved to HTML to get any kind of formatting at all. Its not the place to be creating proper reports. To get full functionality output to a file, one of the many types.
What you could try is putting your three datasets together, with a column for the differentiation, and then proc sgpanel'ing them:
data want;
  set output_e (in=a rename=(orden_e=x e_original=y))
       output_m (in=b rename=...)
       output_v (in=c rename=...);
  if a then group="Abc";
  else if b then group="Def";
  else group="Ghi";
run;

proc sgpanel data=want;
  panelby group;
  series x=x y=y;
run;
Oh, and move up to 9.4, many good things extra!
- Mark as New
- Bookmark
- Subscribe
- Mute
- RSS Feed
- Permalink
- Report Inappropriate Content
Hi RW9,
Thank you once more for your response.
What I meant with SAS Report format, was the format of the Results window, the option you can choose from Enterprise Guide
Tools > Options > Results > Results general
The last option you suggested works almost great, I had to apply the columns=3 option in the panelby statement but the axis are being displayed identically for three plots, so I am losing vision here:
Anyway, this is the best approach so far, thank you very much for your time!
At the end I had to export the results to an xls file, set the linear drift as a parameter and run VBA in order to make the plots dynamic...
I'm considering moving up to 9.4 soon!
- Mark as New
- Bookmark
- Subscribe
- Mute
- RSS Feed
- Permalink
- Report Inappropriate Content
I don't believe ODS layout gridded is supported in SAS 9.2. You may want to investigate Layout gridded and/or layout overlay in the Graph Template Language.

The 2025 SAS Hackathon has begun!
It's finally time to hack! Remember to visit the SAS Hacker's Hub regularly for news and updates.
Learn how use the CAT functions in SAS to join values from multiple variables into a single value.
Find more tutorials on the SAS Users YouTube channel.
SAS Training: Just a Click Away
Ready to level-up your skills? Choose your own adventure.


