- Home
- /
- Programming
- /
- ODS Reports
- /
- Re: Creating labels for summary variables on the fly in Proc Tabulate ...
- RSS Feed
- Mark Topic as New
- Mark Topic as Read
- Float this Topic for Current User
- Bookmark
- Subscribe
- Mute
- Printer Friendly Page

- Mark as New
- Bookmark
- Subscribe
- Mute
- RSS Feed
- Permalink
- Report Inappropriate Content
Hi all,
I am creating a trending report using Proc Tabulate procedure. The class variables have many levels in it. I am trying to add the level value to the summary variable label. For example, if I want to showcase total attended hours for boys and girls separately over various weeks and years. I would like to keep my total hours label as week1 total hours, week2 total hours , week3 total hours and year to date values as 2011 year to date, 2012 year to date etc.,
PROC TABULATE DATA=attendance ;
class gender/ MISSING;
class WEEK/DESCENDING;
class Year;
TABLE attendance_status all='Total', (YEAR=''* (Gender=''*(WEEK='' all='Total') all="Year to Date")) *(n='attended_hours' *f=comma20. colpctn='attendance_PERCENT' *f=PCTFMT.);
RUN;
currently I am getting a static 'Total' and 'Year to Date' labels for week and Year columns respectively. Is there a way to add the variable value to the auto calculated summary variables in proc tabulate (something like autoname option in proc Means procedure)?
Thank you very much in advance.
Cheers,
Chandra

- Mark as New
- Bookmark
- Subscribe
- Mute
- RSS Feed
- Permalink
- Report Inappropriate Content
Maybe create a new variable or macro can get it . Post you sample data , and the output better it is a picture.
or post it at ODS and Base Reporting Cynthia@sas is good at it.
Xia Keshan

- Mark as New
- Bookmark
- Subscribe
- Mute
- RSS Feed
- Permalink
- Report Inappropriate Content
Hi:
You are getting Total and Year to Date because you've coded them in your TABLE statement for the labels. But you have a worse issue with your code. You show the variable "ATTENDANCE_STATUS" in your TABLE statement, but do not have a class or VAR statement for it. What type of variable is ATTENDANCE_STATUS and does your code even run? I would expect you to see an error message like this:
ERROR: The type of name (attendance_status) is unknown.
cynthia
- Mark as New
- Bookmark
- Subscribe
- Mute
- RSS Feed
- Permalink
- Report Inappropriate Content
Hi Cynthia,
Thanks for your mail. I have just provided a sample code to explain the requirement. My requirement is to get the class variable value appended to the summary label in a dynamic way.
please find the sample code and the required format in the attached file.
options nodate pageno=1 linesize=105 pagesize=60;
data fundrais;
length name $ 8 classrm $ 1;
input @1 team $ @8 classrm $ @10 name $
@19 pencils @23 tablets;
sales=pencils + tablets;
datalines;
BLUE A ANN 4 8
RED A MARY 5 10
GREEN A JOHN 6 4
RED A BOB 2 3
BLUE B FRED 6 8
GREEN B LOUISE 12 2
BLUE B ANNETTE . 9
RED B HENRY 8 10
GREEN A ANDREW 3 5
RED A SAMUEL 12 10
BLUE A LINDA 7 12
GREEN A SARA 4 .
BLUE B MARTIN 9 13
RED B MATTHEW 7 6
GREEN B BETH 15 10
RED B LAURA 4 3
;
proc format;
picture pctfmt low-high='009 %';
run;
title "Fundraiser Sales";
proc tabulate format=7.;
class team classrm;
var sales;
table (team all),
classrm='Classroom'*sales=' '*(sum
colpctsum*f=pctfmt9.)
all*sales*sum=' '
/rts=20;
run;
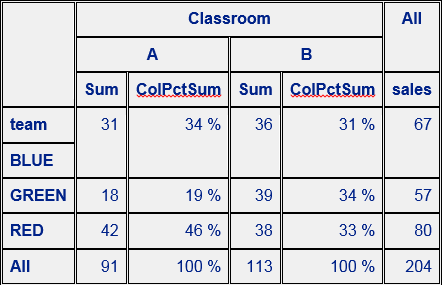
The required forma is
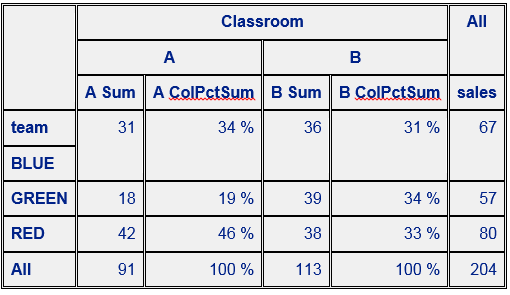
Class variable value should be appended to the summary labels like A sum, B sum etc.,
You may try the following sample code also
data stocks;
set sashelp.stocks;
year=year(date);
month=put(month(date),z2.);
run;
ods html;
proc tabulate data=stocks;
class stock;
class year/descending ;
class month/descending;
var volume;
table stock all='Total', (YEAR=''* (Month='' all=' Year to date') all="All Years total")*volume='' *(sum='Total volume' *f=comma20. colpctsum<volume all>='PERCENT' );
run;
We would like to have the Year value prefixed to the label so that the label should look like 2011 Year to date, 2012 Year to date etc.,
Thank you!
Cheers,
Chandra
- Mark as New
- Bookmark
- Subscribe
- Mute
- RSS Feed
- Permalink
- Report Inappropriate Content
A workaround it to modify HTML resource code directly .
data fundrais;
length name $ 8 classrm $ 1;
input @1 team $ @8 classrm $ @10 name $
@19 pencils @23 tablets;
sales=pencils + tablets;
datalines;
BLUE A ANN 4 8
RED A MARY 5 10
GREEN A JOHN 6 4
RED A BOB 2 3
BLUE B FRED 6 8
GREEN B LOUISE 12 2
BLUE B ANNETTE . 9
RED B HENRY 8 10
GREEN A ANDREW 3 5
RED A SAMUEL 12 10
BLUE A LINDA 7 12
GREEN A SARA 4 .
BLUE B MARTIN 9 13
RED B MATTHEW 7 6
GREEN B BETH 15 10
RED B LAURA 4 3
;
run;
proc format;
picture pctfmt low-high='009 %';
run;
filename want 'c:\temp\want.html';
filename x temp;
title "Fundraiser Sales";
ods listing close;
ods html file=x style=sasweb;
proc tabulate format=7.;
class team classrm;
var sales;
table (team all),
classrm='Classroom'*sales=' '*(sum
colpctsum*f=pctfmt9.)
all*sales*sum=' '
/rts=20;
run;
ods html close;
ods listing;
proc sql noprint;
select count(distinct classrm) into : n from fundrais ;
select distinct quote(classrm) into : list separated by ' ' from fundrais ;
quit;
data _null_;
infile x lrecl=32767 length=len;
file want lrecl=32767;
array z{&n} $ 40 _temporary_ (&list);
input x $varying32767. len;
if prxmatch('/.*Header.*>Sum<.*/i',x) then do;
i+1;
x='<th class="c Header" scope="col">'||strip(z{i})||' Sum</th>'; len=len+40;
end;
else if prxmatch('/.*Header.*>ColPctSum<.*/i',x) then do;
x='<th class="c Header" scope="col">'||strip(z{i})||' ColPctSum</th>'; len=len+40;
end;
put x $varying32767. len;
run;
Xia Keshan
- Mark as New
- Bookmark
- Subscribe
- Mute
- RSS Feed
- Permalink
- Report Inappropriate Content
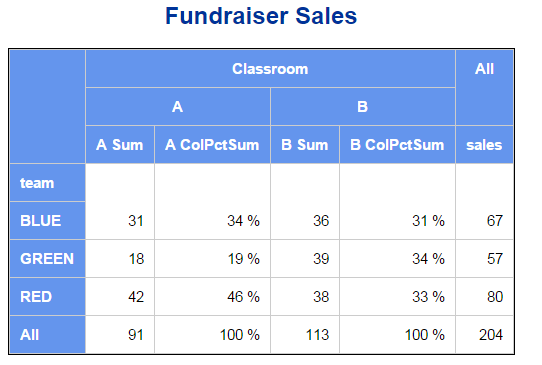
Hi:
Dynamic labeling, as you call it, of the column headers underneath a nesting is not possible with PROC TABULATE. Your only option would be to create an HTML file and then post process the HTML tags and change the text to be what you want. Or, to create an output dataset and then pass summarized variables to another procedure, such as PROC REPORT.
BTW options like LINESIZE and PAGESIZE and RTS are ignored by ODS destinations because they are LISTING only options. Here is some code to test that uses 2 PROC REPORTs to do what you want. The first one creates a dataset, the second one has the names you want. This could easily be "macroized"; or you could post process the HTML file. The only issue is that if you wanted PDF output, then the PROC REPORT approach would be the better approach, since you can't really "post process" the PDF file. Increased the number of decimal places on the format so you could see the rounding differences between a picture format and a SAS defined format. (If you do not understand the _c2_ _c3_, etc, then my suggestion is that you read up on how PROC REPORT handles ACROSS variables.)
Cynthia
options nodate;
data fundrais;
length name $ 8 classrm $ 1;
input @1 team $ @8 classrm $ @10 name $
@19 pencils @23 tablets;
sales=pencils + tablets;
datalines;
BLUE A ANN 4 8
RED A MARY 5 10
GREEN A JOHN 6 4
RED A BOB 2 3
BLUE B FRED 6 8
GREEN B LOUISE 12 2
BLUE B ANNETTE . 9
RED B HENRY 8 10
GREEN A ANDREW 3 5
RED A SAMUEL 12 10
BLUE A LINDA 7 12
GREEN A SARA 4 .
BLUE B MARTIN 9 13
RED B MATTHEW 7 6
GREEN B BETH 15 10
RED B LAURA 4 3
;
run;
proc format;
picture pctfmt low-high='009.99 %';
run;
ods html file='c:\temp\rename_across_headers_with_report.html';
proc tabulate data=fundrais format=9.;
title '1) TABULATE';
class team classrm;
var sales;
table (team all),
classrm='Classroom'*sales=' '*(sum colpctsum*f=pctfmt.)
all*sales*sum=' ';
run;
proc report data=fundrais nowd
out=repout(where=(team gt ' '));
title '2) First Report Example Summarizes Data and Calcs Percents';
column team classrm,(sales salesp) sales=total;
define team / group;
define classrm / across;
define sales / sum;
define salesp / computed f=percent9.2;
define total / sum 'All';
compute before;
totc2 = _c2_;
totc4 = _c4_;
endcomp;
compute salesp;
_c3_ = _c2_ / totc2;
_c5_ = _c4_ / totc4;
endcomp;
rbreak after / summarize;
compute after;
team = 'All';
endcomp;
run;
proc print data=repout ;
title '3) Data Set From Proc Report (percent not multiplied by 100)';
run;
proc report data=repout nowd;
title '4) Final PROC REPORT -- use SAS Percent format';
where team gt ' ';
column team ('Classroom' ('A' _c2_ _c3_) ('B' _c4_ _c5_)) Total;
define team / order order=data style(column)=Header;
define _c2_ / display 'A Sum';
define _c3_ / display 'A ColPctSum' f=percent9.2;
define _c4_ / display 'B Sum';
define _c5_ / display 'B ColPctSum' f=percent9.2;
define total / 'All';
run;
ods html close;
.jpg")
Catch up on SAS Innovate 2026
Nearly 200 sessions are now available on demand with the SAS Innovate Digital Pass.
Explore Now →Learn how use the CAT functions in SAS to join values from multiple variables into a single value.

Find more tutorials on the SAS Users YouTube channel.
SAS Training: Just a Click Away
Ready to level-up your skills? Choose your own adventure.
-
5 replies
-
01-12-2015 06:10 AM
-
3904 views
-
4 likes
-
3 in conversation
-
