- Home
- /
- Programming
- /
- ODS Reports
- /
- Can PDF and TOCs really be customised?
- RSS Feed
- Mark Topic as New
- Mark Topic as Read
- Float this Topic for Current User
- Bookmark
- Subscribe
- Mute
- Printer Friendly Page

- Mark as New
- Bookmark
- Subscribe
- Mute
- RSS Feed
- Permalink
- Report Inappropriate Content
I currently generate a large number of reports using HTML pages, with a javascript menu for navigation.
It has been suggested that publishing these reports as a PDF book might be better.
A sensible TOC is a must due to the sheer number of reports.
A quick mock-up raised a few issues. I managed to get a reasonable TOC:
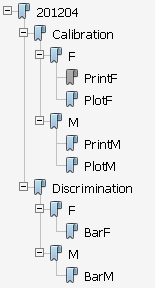
I had to use a few less-than-desirable shortcuts however:
1) If I try to use ODS layout, the TOC is jumbled up. How can I get PrintF and PlotF on one page?
Even obpage /delete didn't work.
2) I have to reference all outputs by their path to organise the document.
This will be way too difficult to manage and error-prone with hundreds of outputs.
I need to reference something else like their name. Even that will be interesting to organise.
Depending on the procedures, using names means that:
- no output is generated (gplot)
- an output is generated with an extra TOC hierarchy layer (gchart)
- I can't even see names (proc print)
Is there a point in my trying to create a PDF book or is this idea doomed to fail?
Also:
- is drill-down working well with ODS PDF? I've read that PS is a better destination for that.
- any way to get tooltips on graphs in a PDF document?
Thanks for your insight. The existing code:
%macro DeleteGraphEntry(path); * delete graphs before creation to keep names;
%if %length(%scan(&path,3))=0 %then %let path=WORK.&path;
%if %sysfunc(cexist(&path..GRSEG)) %then %do;
proc catalog c=%scan(&path,1).%scan(&path,2);delete %scan(&path,3).GRSEG;quit;
%end;
%mend;
title;
ods listing close;
ods document name=WORK.TEST(write);
proc print data=SASHELP.CLASS(where=(SEX='F')) contents='PrintF';run;
%DeleteGraphEntry(GSEG.PLOTF);
proc gplot data=SASHELP.CLASS(where=(SEX='F'));
plot HEIGHT*WEIGHT/name='PLOTF' des='PlotF'; run; quit;
proc print data=SASHELP.CLASS(where=(SEX='M')) contents='PrintM';run;
%DeleteGraphEntry(GSEG.PLOTM);
proc gplot data=SASHELP.CLASS(where=(SEX='M'));
plot HEIGHT*WEIGHT/name='PLOTM' des='PlotM'; run; quit;
%DeleteGraphEntry(GSEG.BARF);
proc gchart data=SASHELP.CLASS(where=(SEX='F'));
vbar AGE/name='BARF' des='BarF'; run; quit;
%DeleteGraphEntry(GSEG.BARM);
proc gchart data=SASHELP.CLASS(where=(SEX='M'));
vbar AGE/name='BARM' des='BarM'; run; quit;
ods document close;
proc document name=WORK.TEST;
ods listing;
list /levels=all;run;
ods listing close;
make \MONTH;
setlabel \MONTH#1 '201204';
make \MONTH\CAL;
setlabel \MONTH#1\CAL#1 'Calibration';
make \MONTH\CAL\F;
setlabel \MONTH#1\CAL#1\F#1 'F';
copy \Print#1\Print#1 to \MONTH#1\CAL#1\F#1;
copy \Gplot#1\PLOTF#1 to \MONTH#1\CAL#1\F#1;
make \MONTH\CAL\M;
setlabel \MONTH#1\CAL#1\M#1 'M';
copy \Print#2\Print#1 to \MONTH#1\CAL#1\M#1; * no names for proc print?;
copy \Gplot#2\PLOTM#1 to \MONTH#1\CAL#1\M#1;
*copy (where=(_NAME_='PLOTM' and _TYPE_='Graph')) to \MONTH#1\CAL#1\M#1;*no output;
make \MONTH\DIS;
setlabel \MONTH#1\DIS#1 'Discrimination';
make \MONTH\DIS\F;
setlabel \MONTH#1\DIS#1\F#1'F';
copy \Gchart#1\BARF#1 to \MONTH#1\DIS#1\F#1;
*copy \GCHART (where=(_NAME_='BARF' and _TYPE_='Graph')) to \MONTH#1\DIS#1\F#1;*bad toc;
make \MONTH\DIS\M;
setlabel \MONTH#1\DIS#1\M#1 'M';
copy \Gchart#2\BARM#1 to \MONTH#1\DIS#1\M#1;
run;
ods listing;
list /levels=all;run;
ods listing close;
ods pdf file="test2.pdf";
replay \MONTH ; run;
ods pdf close;
quit;
- Mark as New
- Bookmark
- Subscribe
- Mute
- RSS Feed
- Permalink
- Report Inappropriate Content
OK, it seems that ODS is still in its infancy, and this is too ambitious for its current capabilities.
I'll stick with js and HTML for now then.
Thanks to all who had a look.

- Mark as New
- Bookmark
- Subscribe
- Mute
- RSS Feed
- Permalink
- Report Inappropriate Content
Hi:
I think that many of your questions are for Tech Support. In particular:
1) ODS LAYOUT is experimental, if there are adverse interactions between ODS LAYOUT and ODS DOCUMENT, this is something that should be reported and if there is a workaround, only Tech Support would know (or could find out from the LAYOUT and PDF developers). Also your comment about OBPAGE and DELETE not working for your DOCUMENT....you'd have to check with Tech Support, but I think that if your graph is too large (it fits the whole page), then no matter what you do, I don't think you would see the results of OBPAGE/DELETE -- have you tried explicitly sizing the graph so it is about a half-page in size?? Using GOPTIONS like HSIZE and VSIZE???
2) Reference by path: I think this is true that you have to reference by PATH for ODS DOCUMENT -- you can use WHERE expressions in your path specification, but frequently I find that in order to select one and only one object, I have such a complicated WHERE expression that I may as well have used the PATH. Generally, though, since you can capture the list of document objects into a file, my tendency with complicated copies would be to use make a dataset of the original directory, read the information and then use macro processing to generate the ODS DOCUMENT/PROC DOCUMENT code.
3) Not sure what you mean about not being able to see names with PROC PRINT -- I almost always use PROC REPORT or PROC TABULATE with ODS DOCUMENT -- so I'd recommend working with Tech Support on this, too. Also, related, I'm not sure what you mean by the GPLOT, GCHART comments about names. This Tech Support note shows using ODS DOCUMENT using GPLOT...http://support.sas.com/kb/36/505.html and this one shows GCHART http://support.sas.com/kb/42/764.html
Also I noticed that you are creating work.test and then modifying work.test. As a best practice, I generally don't recommend this. Usually, I make my "original" and then I make an new, empty document in which to place my new folder structure and start copying my objects. Then once I have the new structure, I go back and clean up the page breaks, labels, etc. Since the syntax is so "DOS-y" for PROC DOCUMENT in batch, I generally start at the root folder, navigate my way down the folder tree and then just do a copy to ^, which eliminates the need for repeating a long path or giving a specific object name on the TO side of the COPY.
Drill-down and PDF: This documentation topic explains about drill-downs in SAS 9.3 with PDF -- the recommendation in the doc is for PDF or PRINTER destinations:
But, I would think you'd need to check with Tech Support about whether the drill-downs would remain intact once you put the graph object into an ODS DOCUMENT store and then done a REPLAY.
cynthia
- Mark as New
- Bookmark
- Subscribe
- Mute
- RSS Feed
- Permalink
- Report Inappropriate Content
Hi Cynthia,
Thanks for your detailed reply.
1) HSIZE does the trick with obpage / delete, thank you .
2) I simply cannot reference paths. The book contains almost 4000 charts. Each has a unique name (though that's not always under control, another tech support issue) and using names is the only sane way to organise these charts (for eg, charts are sometimes missing because there is no data, etc, so paths will vary and cannot be relied on).
I may be able to count and record outputs as I go (though I hate to think what would happen when I rerun a subsection and have to recreate the whole book) but I have better things to do that to try and make this work. Names are the way.
3a) Using
copy \GPLOT (where=(_NAME_='PLOTM' and _TYPE_='Graph'))
creates
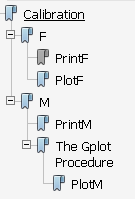
See how an extra unwanted DIR has been copied for PlotM? Even though I specified _TYPE_='Graph'?
ods proclabel doesn't change that either.
Note: when I use where=, PlotM now creates the extra TOC hierarchy layer, and BarF is not copied at all.
It was the opposite last week.
3b) I only use proc print to display messages (such as "no chart created"). I could use proc report for that though is it overkill, when that's the least detail to iron out, and for example issues 2) and 3a) are sorted.
Bottom line: this would take too much time to make work (assuming it can, which looks unlikely), I could be full-time QA tester for sas, I have too many contacts with tech support already (3 tracks atm including one on proc document), so I think I'll wait till ODS matures, gains features, consistency, and stability before embarking on a large PDF book.
It was worth having a look, but I reckon it is not worth spending what looks like weeks of fiddling, in my case: What I already have will have to suffice, especially since it includes native drill-down and tooltips, another potential can of worms not even tested in this basic mock-up.
- Mark as New
- Bookmark
- Subscribe
- Mute
- RSS Feed
- Permalink
- Report Inappropriate Content
Fyi, a defect has been created for the move vs copy issue.
.jpg")
Catch up on SAS Innovate 2026
Nearly 200 sessions are now available on demand with the SAS Innovate Digital Pass.
Explore Now →Learn how use the CAT functions in SAS to join values from multiple variables into a single value.

Find more tutorials on the SAS Users YouTube channel.
SAS Training: Just a Click Away
Ready to level-up your skills? Choose your own adventure.
-
4 replies
-
05-22-2012 11:57 PM
-
2449 views
-
3 likes
-
2 in conversation
-
