- Home
- /
- Programming
- /
- Graphics
- /
- gplot: sum on symbol like sum on bar in gchart possible?
- RSS Feed
- Mark Topic as New
- Mark Topic as Read
- Float this Topic for Current User
- Bookmark
- Subscribe
- Mute
- Printer Friendly Page
- Mark as New
- Bookmark
- Subscribe
- Mute
- RSS Feed
- Permalink
- Report Inappropriate Content
Dear all,
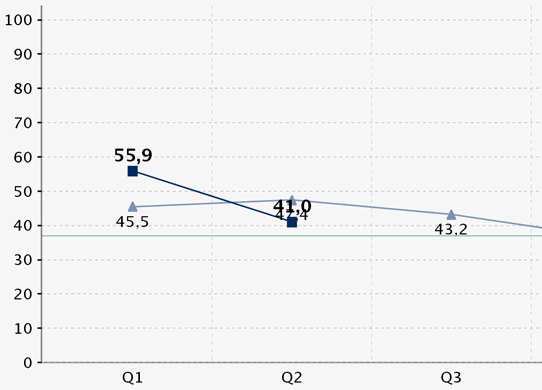
I have a plot with connected symbols. Is it possible to write the vaxis value on top of each symbol like in this example?

I know it is possible with prog gchart... vbar. You simply write sum into the vbar statement. I tried it with the plot statement but get the error that the syntax is not correct.
Best wishes
Eva
Accepted Solutions
- Mark as New
- Bookmark
- Subscribe
- Mute
- RSS Feed
- Permalink
- Report Inappropriate Content
You can use Proc Gplot's "pointlabel" for that. By default, it uses the y-value as the label (which is what you want, I believe?). You can also customize the label, and use another variable if you want.
symbol1 value=dot interpol=none pointlabel;
proc gplot data=sashelp.class;
plot height*weight=1;
run;
- Mark as New
- Bookmark
- Subscribe
- Mute
- RSS Feed
- Permalink
- Report Inappropriate Content
Dear Robert,
thanx. I would never have googled for "pointlabel" 🙂 It works. And foundit now in the sas help.
Best wishes
Eva
- Mark as New
- Bookmark
- Subscribe
- Mute
- RSS Feed
- Permalink
- Report Inappropriate Content
I formatted the variable I user for the pointlabel now in commax10.2
Unfortunately then the values on the y-axis are also in this format. Can I use a different format for the values on an axis?
- Mark as New
- Bookmark
- Subscribe
- Mute
- RSS Feed
- Permalink
- Report Inappropriate Content
That's where the "You can also customize the label, and use another variable if you want" comes in, such as ...
data my_data; set sashelp.class;
my_text=put(height,commax10.2);
run;
symbol1 value=dot interpol=none pointlabel=('#my_text');
proc gplot data=my_data;
plot height*weight=1;
run;
- Mark as New
- Bookmark
- Subscribe
- Mute
- RSS Feed
- Permalink
- Report Inappropriate Content
Unfortunately not supported by activex. Like axis split='...' is not 😞
- Mark as New
- Bookmark
- Subscribe
- Mute
- RSS Feed
- Permalink
- Report Inappropriate Content
Ahh - you hadn't mentioned you were using Activex!
A lot of little things aren't supported in dev=Activex (and dev=Java), and you are quite likely to bump into these when creating custom graphs. Therefore, I always recommend that people creating custom graphs use dev=png.
Learn how use the CAT functions in SAS to join values from multiple variables into a single value.
Find more tutorials on the SAS Users YouTube channel.
SAS Training: Just a Click Away
Ready to level-up your skills? Choose your own adventure.


