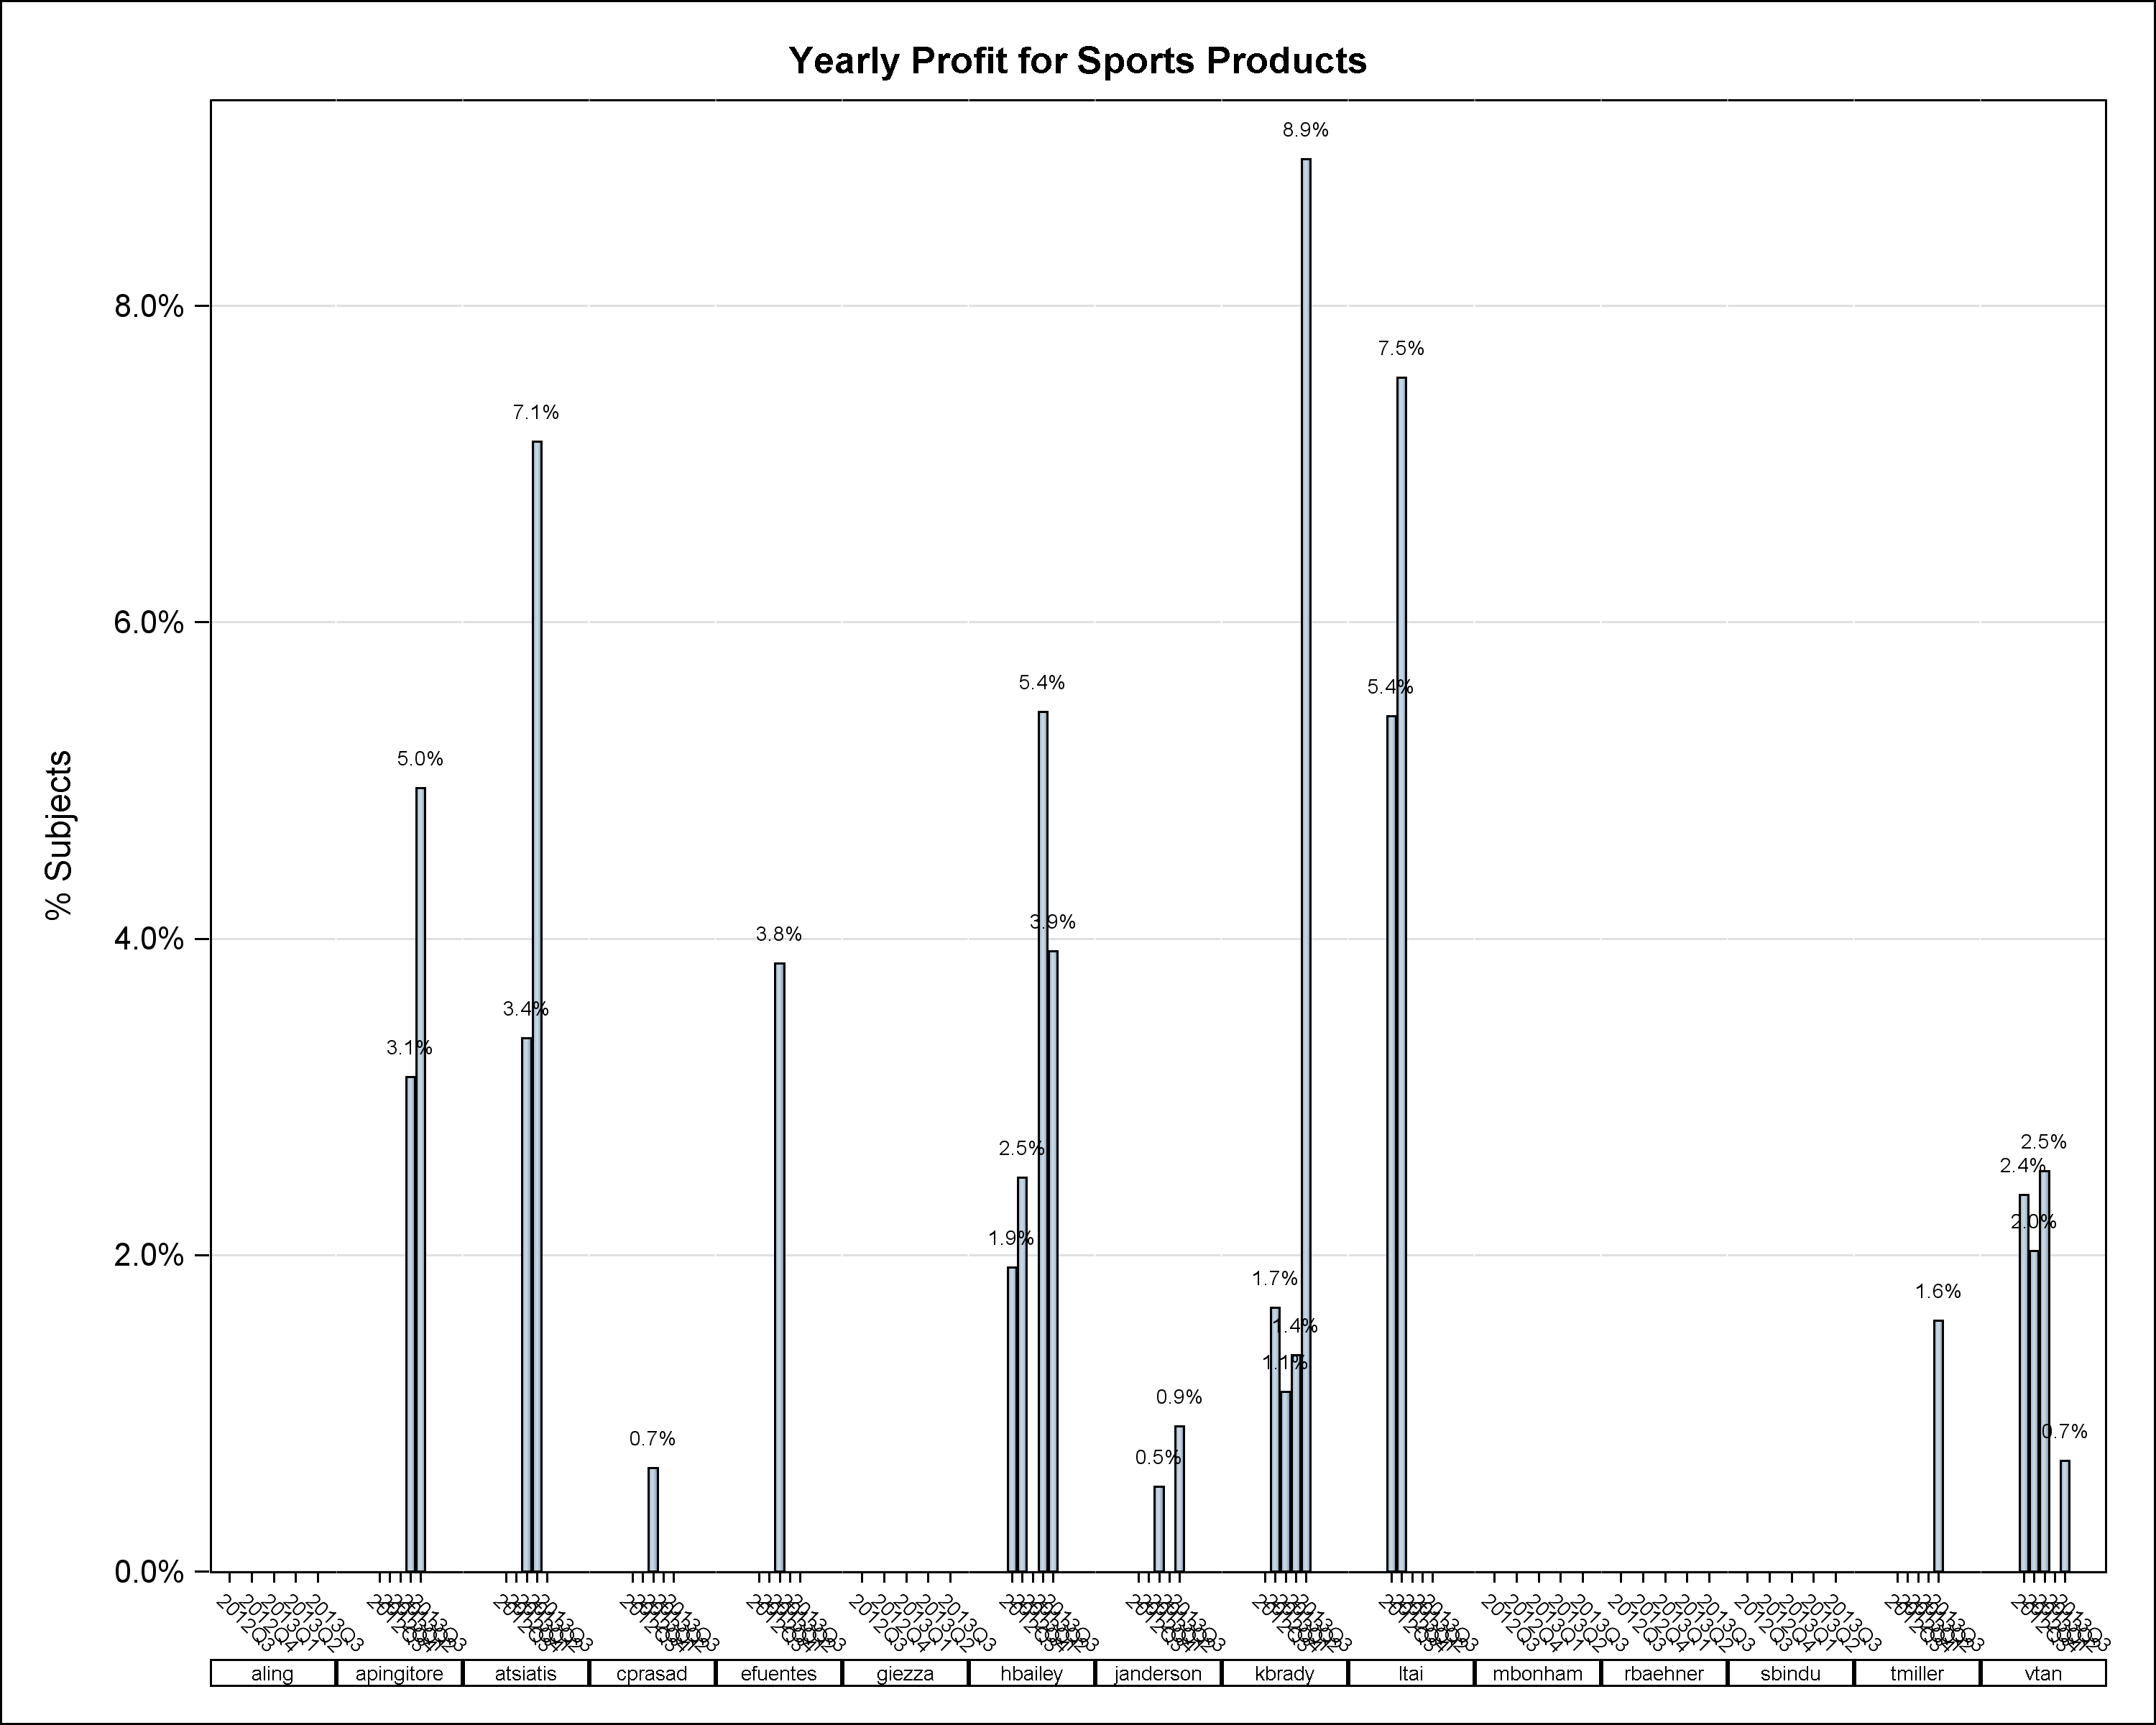
Hi,
I am trying to generate some barchat using GTL but I have a problem with the bar width and I am not sure to understand why.
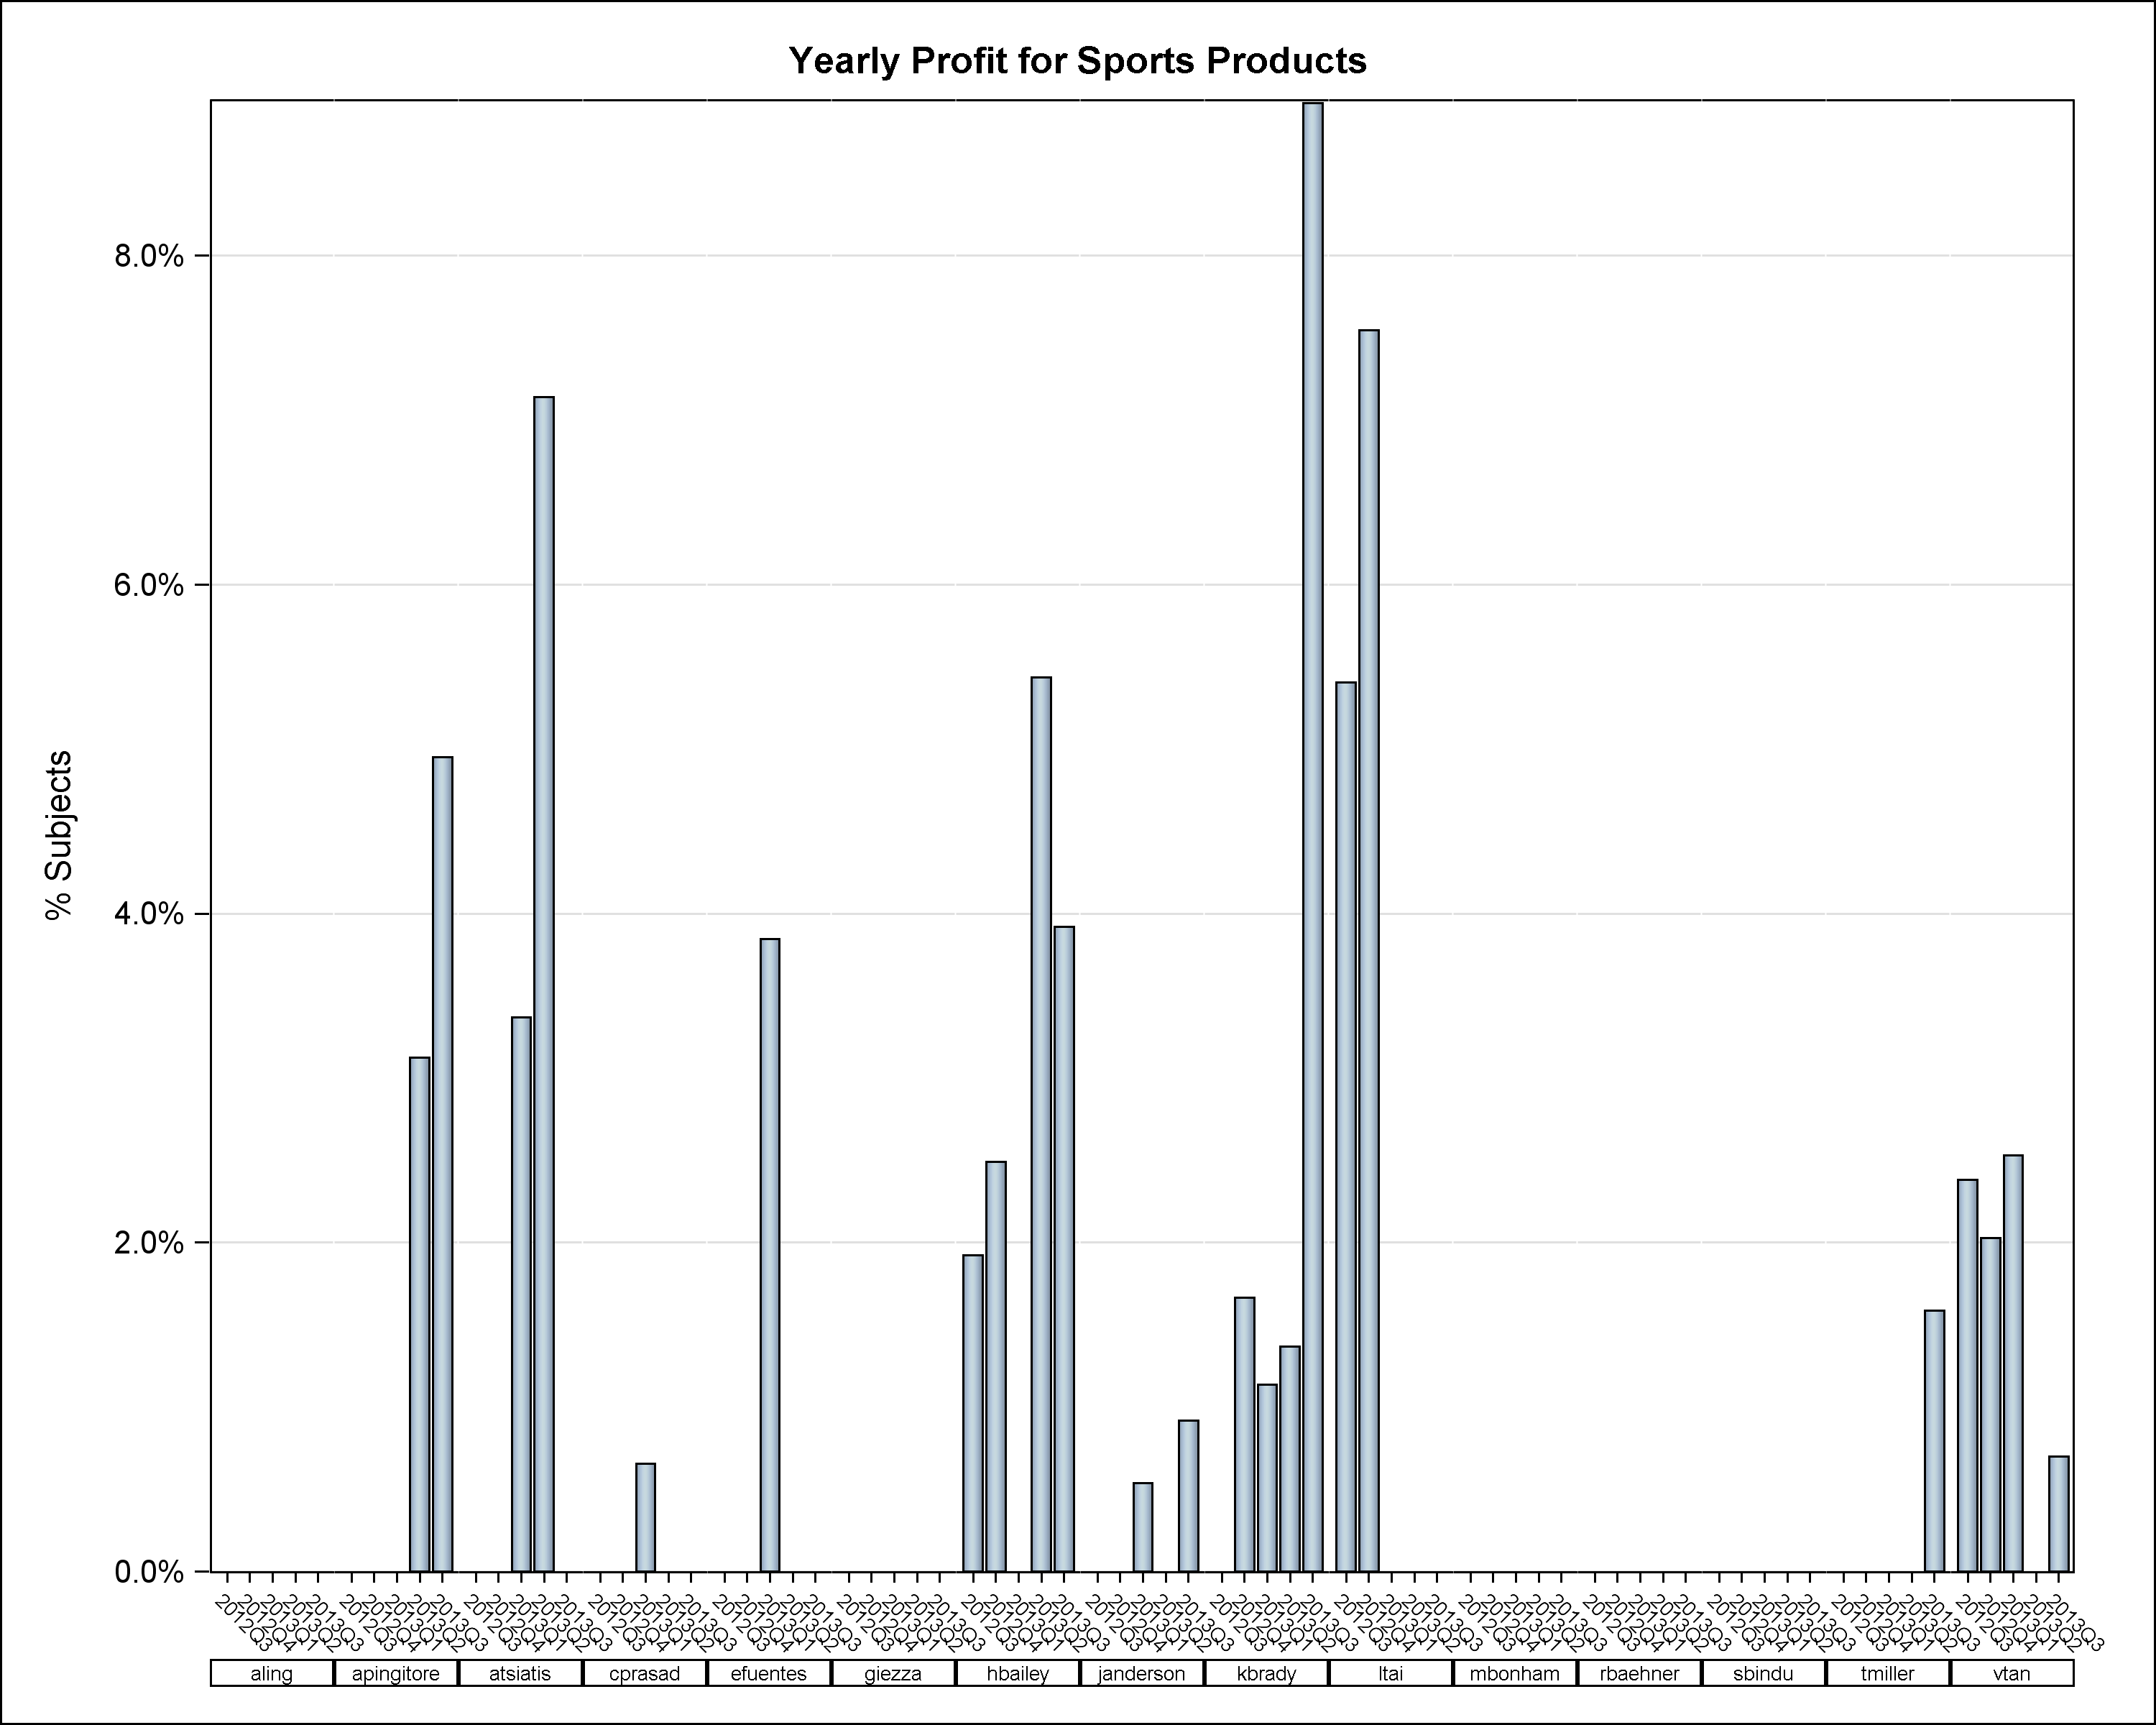
When I add the barlabel=true option, the bar are very narrowed. but if I remove this option it looks much better. Do you kwnow why this label option modify the bar widht?
Here is the code I use:
proc template;
define statgraph testgraph;
begingraph;
layout gridded / border=false;
layout datalattice columnvar=path / headerlabeldisplay=value HEADERLABELATTRS=(SIZE=6px) cellwidthmin=20
columnheaders=bottom border=false columndatarange=union
columnaxisopts=(TICKVALUEATTRS=(SIZE=6pt) display=(line TICKS tickvalues))
rowaxisopts=(offsetmin=0
label='% Subjects' griddisplay=on);
layout prototype / walldisplay=(fill) WALLCOLOR=white;;
barchart x=quarter y=colj / skin=modern barlabel=true BARLABELATTRS=(SIZE=6pt);
endlayout;
endlayout;
endlayout;
endgraph;
end;
run;
ods graphics on / reset=all height=800px width=1000px antialias=on;
proc sgrender data=test template=testgraph;
run;
ods graphics off
Plot without barlabel option:
Plot with barlabel option: