- Home
- /
- Programming
- /
- Graphics
- /
- Wordwrap Seriesplot
- RSS Feed
- Mark Topic as New
- Mark Topic as Read
- Float this Topic for Current User
- Bookmark
- Subscribe
- Mute
- Printer Friendly Page

- Mark as New
- Bookmark
- Subscribe
- Mute
- RSS Feed
- Permalink
- Report Inappropriate Content
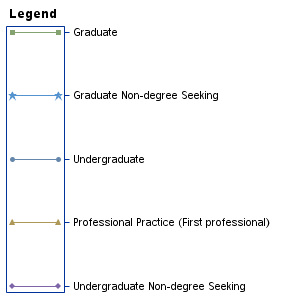
I have an independent legend created from a series plot using the code below. The legend is functional however it is a larger than I would like. Ideally I would like to make the image smaller by word wrapping the yaxis = y2 section. Even more ideal would be to be able to control where the word wrap occurs.
proc template;
define statgraph order;
dynamic TITLE1 TITLE2;
begingraph;
entrytitle TITLE1;
entrytitle TITLE2;
layout overlay / xaxisopts =(display = NONE) yaxisopts = (display = NONE) border=false
y2axisopts = ( reverse = true label = " "
linearopts= ( tickvaluesequence=(start=1 end=32 increment=1)));
seriesplot x=xax y= &Student_or_Degree_Level / yaxis = y2 display = all group=&Student_or_Degree_Level
index = index lineattrs = (pattern =1 thickness = 1);
endlayout;
endgraph;
end;
run;
Accepted Solutions

- Mark as New
- Bookmark
- Subscribe
- Mute
- RSS Feed
- Permalink
- Report Inappropriate Content
With ODS graphics questions it is a good idea to include which version of SAS you are running as there have been significant changes in each version and a recommendation based on 9.4 may not help if you are running 9.2. Also your final desired output destination such as HTML, PDF or RTF may affect the outcome.
It may be as simple as having a format a format for your &student_or_degree_level variable that has display values that include \n such as:
proc format;
/* 1 below is just used for an example, use your values of course*/
value mylabel
1 = "Professional Practice \n (first professional)"
;
run;
and in the SGRender code have a format statement associating the variable with the label format.

- Mark as New
- Bookmark
- Subscribe
- Mute
- RSS Feed
- Permalink
- Report Inappropriate Content
With SAS 9.4 GTL, you can use TickValueFitPolicy in DiscreteOpts with the Y2AxisOpts to wrap the text. You can use specific split characters if you want to control where the split occurs.
- Mark as New
- Bookmark
- Subscribe
- Mute
- RSS Feed
- Permalink
- Report Inappropriate Content
I am using SAS 9.2. Ballardw your example using proc format with \n should solve what I need.
.jpg")
Catch up on SAS Innovate 2026
Nearly 200 sessions are now available on demand with the SAS Innovate Digital Pass.
Explore Now →Learn how use the CAT functions in SAS to join values from multiple variables into a single value.

Find more tutorials on the SAS Users YouTube channel.
SAS Training: Just a Click Away
Ready to level-up your skills? Choose your own adventure.
-
3 replies
-
01-06-2015 09:59 AM
-
2491 views
-
3 likes
-
3 in conversation
-
