Turn on suggestions
Auto-suggest helps you quickly narrow down your search results by suggesting possible matches as you type.
Showing results for
- Home
- /
- Programming
- /
- Graphics
- /
- SGPLOT - graph shape square
Options
- RSS Feed
- Mark Topic as New
- Mark Topic as Read
- Float this Topic for Current User
- Bookmark
- Subscribe
- Mute
- Printer Friendly Page

Calcite | Level 5
- Mark as New
- Bookmark
- Subscribe
- Mute
- RSS Feed
- Permalink
- Report Inappropriate Content
Posted 05-13-2010 01:51 PM
(5061 views)
How do I get SAS to print an ellipse plot as square, size n by n? Regardless of axis range for either x or y, each axis should have the same length (ie. 5") on the figure generated / printed. SAS ellipse plots printed in landscape are NOT the same (different angle of rotation, major and minor axis are not perpendicular, etc) as ellipse plots in a square. SAS ellipse plots in landscape are not correct - only distortions of an ellipse plot in a square.
proc sgplot data=WORK;
scatter x=afp y=ue3;
ellipse x=afp y=ue3 /alpha=0.05;
run;
Thanks,
Lou
proc sgplot data=WORK;
scatter x=afp y=ue3;
ellipse x=afp y=ue3 /alpha=0.05;
run;
Thanks,
Lou
4 REPLIES 4

Meteorite | Level 14
- Mark as New
- Bookmark
- Subscribe
- Mute
- RSS Feed
- Permalink
- Report Inappropriate Content
Hopefully one of the sgplot experts can give you an answer.
But, if you can't find a way to do it in sgplot, you might give gplot a try - you can specify a length (in inches) in the axis statements, and it will generally try to honor that (thereby giving you a way to keep the axes & your plot proportional).
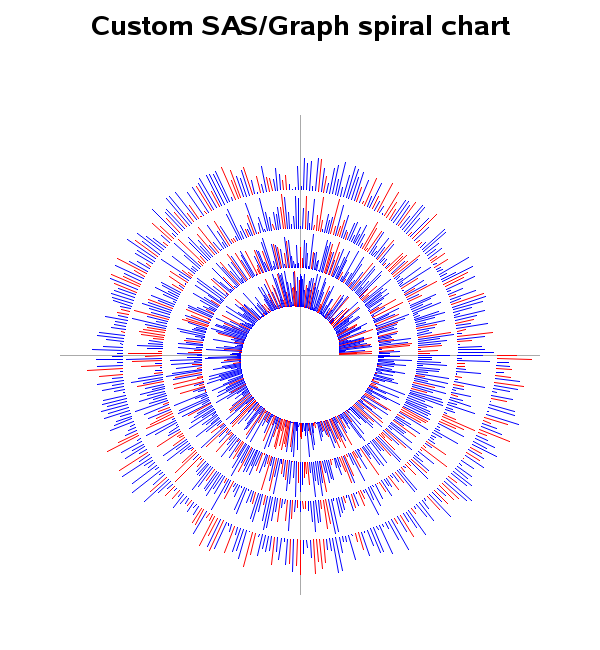
As an example, below is the code for a "spiral" time-series plot - I wanted to keep the 2 axes proportional (whether title statements got added, etc) so that the spiral would not look "squished".
-----
http://robslink.com/SAS/democd46/spiral_info.htm
Message was edited by: Robert Allison @ SAS Message was edited by: Robert Allison @ SAS
But, if you can't find a way to do it in sgplot, you might give gplot a try - you can specify a length (in inches) in the axis statements, and it will generally try to honor that (thereby giving you a way to keep the axes & your plot proportional).
As an example, below is the code for a "spiral" time-series plot - I wanted to keep the 2 axes proportional (whether title statements got added, etc) so that the spiral would not look "squished".
-----
http://robslink.com/SAS/democd46/spiral_info.htm
Message was edited by: Robert Allison @ SAS Message was edited by: Robert Allison @ SAS
Calcite | Level 5
- Mark as New
- Bookmark
- Subscribe
- Mute
- RSS Feed
- Permalink
- Report Inappropriate Content
Thanks - I'll give this a try. Lou

SAS Super FREQ
- Mark as New
- Bookmark
- Subscribe
- Mute
- RSS Feed
- Permalink
- Report Inappropriate Content
Currently, the SG procedures do not support equated axes but the Graph Template Language (GTL) does. Here is a very simple example to get you started. Details for the template language can be found in the documentation.
Thanks!
Dan
[pre]
proc template;
define statgraph square;
begingraph;
layout overlayequated / equatetype=square;
scatterplot x=weight y=height;
ellipse x=weight y=height / alpha=0.05 type=predicted;
endlayout;
endgraph;
end;
run;
proc sgrender data=sashelp.class template=square; run;
[/pre]
Thanks!
Dan
[pre]
proc template;
define statgraph square;
begingraph;
layout overlayequated / equatetype=square;
scatterplot x=weight y=height;
ellipse x=weight y=height / alpha=0.05 type=predicted;
endlayout;
endgraph;
end;
run;
proc sgrender data=sashelp.class template=square; run;
[/pre]
Calcite | Level 5
- Mark as New
- Bookmark
- Subscribe
- Mute
- RSS Feed
- Permalink
- Report Inappropriate Content
Thanks - I'll give this a try. Lou
.jpg")
Catch up on SAS Innovate 2026
Nearly 200 sessions are now available on demand in the Innovate Hub.
Watch Now →How to Concatenate Values
Learn how use the CAT functions in SAS to join values from multiple variables into a single value.

Find more tutorials on the SAS Users YouTube channel.
SAS Training: Just a Click Away
Ready to level-up your skills? Choose your own adventure.
Discussion stats
-
4 replies
-
05-13-2010 01:51 PM
-
5062 views
-
0 likes
-
3 in conversation
-
