- Home
- /
- Programming
- /
- Graphics
- /
- Proc Gchart: Pie error
- RSS Feed
- Mark Topic as New
- Mark Topic as Read
- Float this Topic for Current User
- Bookmark
- Subscribe
- Mute
- Printer Friendly Page
- Mark as New
- Bookmark
- Subscribe
- Mute
- RSS Feed
- Permalink
- Report Inappropriate Content
Hello,
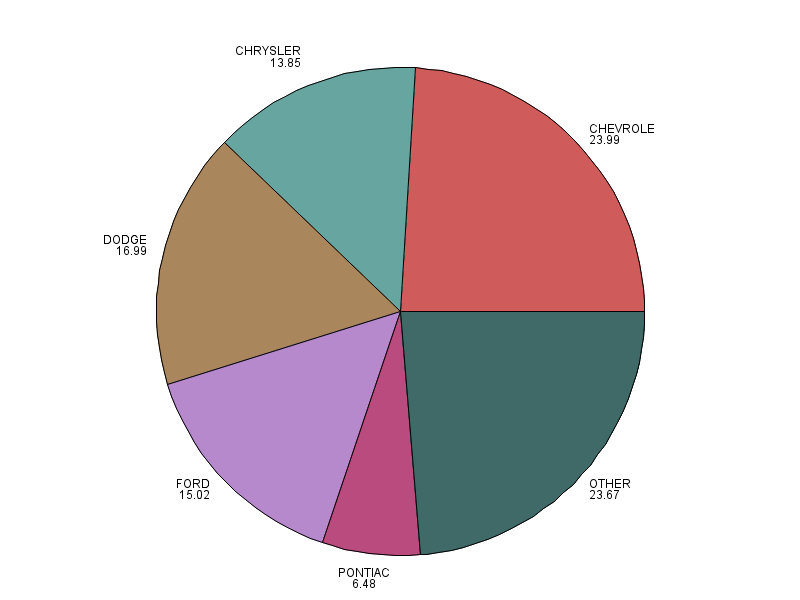
I just spotted an error, which I don't know how to solve programmatically. I have the frequency table below and I wanted to create a pie for the major 5 car manufacturers and group the rest in the category named "other." I used the other=5 option but the resulting pie is not correct. The "other" category should be 24% and not 16%. By looking at the log, I realized that SAS ignored any observation that had a relative frequency less than 1%. Do you know why is it doing that?
data cars;
input make $ count percent;
datalines;
PLYMOUTH 1 0.0530786
SCION 1 0.0530786
SUBARU 1 0.0530786
VOLKSWAGEN 1 0.0530786
INFINITI 2 0.1061571
LINCOLN 2 0.1061571
ISUZU 4 0.2123142
OLDSMOBILE 7 0.3715499
GMC 14 0.7430998
HONDA 14 0.7430998
BUICK 16 0.8492569
MERCURY 19 1.0084926
MITSUBISHI 26 1.3800425
MAZDA 28 1.4861996
SUZUKI 30 1.5923567
TOYOTA 30 1.5923567
JEEP 38 2.0169851
HYUNDAI 47 2.4946921
SATURN 52 2.7600849
NISSAN 53 2.8131635
KIA 60 3.1847134
PONTIAC 122 6.4755839
CHRYSLER 261 13.8535032
FORD 283 15.0212314
DODGE 320 16.985138
CHEVROLET 452 23.9915074
run;
ods html;
proc gchart data=cars;
pie make / freq=percent other=5;
run;
ods html close;
Accepted Solutions
- Mark as New
- Bookmark
- Subscribe
- Mute
- RSS Feed
- Permalink
- Report Inappropriate Content
This revised code probably gets you closer to what you are looking for. Probably will want to clean it up some more but thought this would provide a starting place.
ods html;
proc gchart data=cars;
pie make / freq=count other=5 percent=outside ;
run;
ods html close;
EJ
- Mark as New
- Bookmark
- Subscribe
- Mute
- RSS Feed
- Permalink
- Report Inappropriate Content
SAS is working as intended. RTFM (bold added):
FREQ=numeric-variable
specifies a variable whose values weight the contribution of each observation in the computation of the chart statistic. Each observation is counted the number of times specified by the value of numeric-variable for that observation. If the value of numeric-variable is missing, 0, or negative, the observation is not used in the statistic calculation. Non-integer values of numeric-variable are truncated to integers.
- Mark as New
- Bookmark
- Subscribe
- Mute
- RSS Feed
- Permalink
- Report Inappropriate Content
This revised code probably gets you closer to what you are looking for. Probably will want to clean it up some more but thought this would provide a starting place.
ods html;
proc gchart data=cars;
pie make / freq=count other=5 percent=outside ;
run;
ods html close;
EJ
- Mark as New
- Bookmark
- Subscribe
- Mute
- RSS Feed
- Permalink
- Report Inappropriate Content
Since you have pre-calculated your percents in the data set, you could just let gchart sum up those pre-calculated values in the pie slices:
proc gchart data=cars;
pie make / type=sum sumvar=percent other=5 noheader;
run;

Learn how use the CAT functions in SAS to join values from multiple variables into a single value.
Find more tutorials on the SAS Users YouTube channel.
SAS Training: Just a Click Away
Ready to level-up your skills? Choose your own adventure.


