- Home
- /
- Programming
- /
- Graphics
- /
- PROC SGPLOT - LEGEND AND CURVELABEL TOGETHER
- RSS Feed
- Mark Topic as New
- Mark Topic as Read
- Float this Topic for Current User
- Bookmark
- Subscribe
- Mute
- Printer Friendly Page

- Mark as New
- Bookmark
- Subscribe
- Mute
- RSS Feed
- Permalink
- Report Inappropriate Content
Hi All,
I have sas 9.3. I am using SGPLOT and I have set of series plot and the legend for the lines and it works fine.
However I also need to add the label to each lines using curvelabel option so that the eye movement is reduced.
The problem is when I use curvelabel option the legend disappears.
Is there a way that I could have both in my plot?
Thank you for your help.
P.S.
Here is the code and the output as an example.
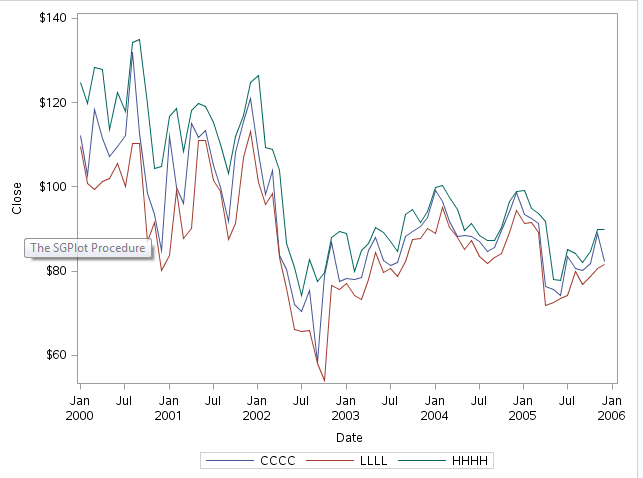
/*THIS GIVES ME THE LEGEND*/
proc sgplot data=sashelp.stocks(where=(date >= "01jan2000"d and stock = "IBM")) ;;
title "Stock Trend : IBM";
series x=date y=close /legendlabel="CCCC";
series x=date y=low /legendlabel="LLLL";
series x=date y=high /legendlabel="HHHH";
run;
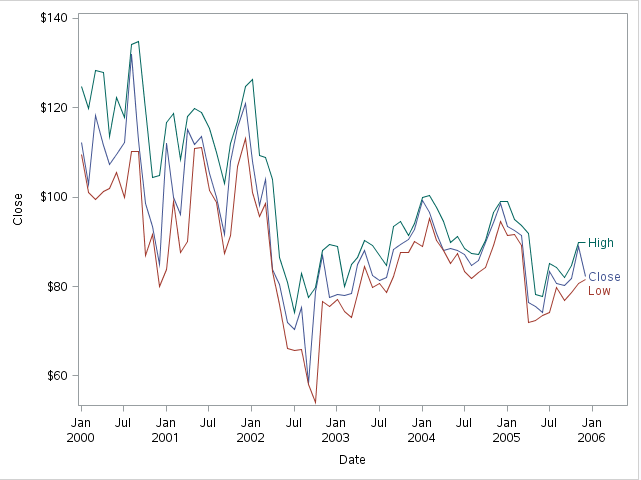
Now I add the curvelabel option. It works but the LEGEND DISAPPEARS
proc sgplot data=sashelp.stocks(where=(date >= "01jan2000"d and stock = "IBM")) ;;
title "Stock Trend : IBM";
series x=date y=close /curvelabel='Close' curvelabelloc=inside curvelabelpos=max legendlabel="CCCC";
series x=date y=low /curvelabel='Low' curvelabelloc=inside curvelabelpos=max legendlabel="LLLL";
series x=date y=high /curvelabel='High' curvelabelloc=inside curvelabelpos=max legendlabel="HHHH";
legend ;
run;
Accepted Solutions

- Mark as New
- Bookmark
- Subscribe
- Mute
- RSS Feed
- Permalink
- Report Inappropriate Content
Does this do what you need:
proc sgplot data=sashelp.stocks(where=(date >= "01jan2000"d and stock = "IBM")) ;;
title "Stock Trend : IBM";
series x=date y=close /curvelabel='Close' curvelabelloc=inside curvelabelpos=max legendlabel="CCCC" name='a';
series x=date y=low /curvelabel='Low' curvelabelloc=inside curvelabelpos=max legendlabel="LLLL" name='b';
series x=date y=high /curvelabel='High' curvelabelloc=inside curvelabelpos=max legendlabel="HHHH" name='c';
keylegend 'a' 'b' 'c';
run;

- Mark as New
- Bookmark
- Subscribe
- Mute
- RSS Feed
- Permalink
- Report Inappropriate Content
Ballardw is correct. By default, a curvelabel removes a plot from the auto legend because it is considered redundant information. Since the curve label was turned on for all three plot, the auto legend disappeared. However, you can override that behavior by creating your own legend, as in Ballardw's example.
- Mark as New
- Bookmark
- Subscribe
- Mute
- RSS Feed
- Permalink
- Report Inappropriate Content
Thanks Ballardw. It solves my problem.
.jpg")
Catch up on SAS Innovate 2026
Nearly 200 sessions are now available on demand with the SAS Innovate Digital Pass.
Explore Now →Learn how use the CAT functions in SAS to join values from multiple variables into a single value.

Find more tutorials on the SAS Users YouTube channel.
SAS Training: Just a Click Away
Ready to level-up your skills? Choose your own adventure.
-
3 replies
-
03-18-2015 04:06 PM
-
6086 views
-
4 likes
-
3 in conversation
-
