- Home
- /
- Programming
- /
- Graphics
- /
- Choose colors for variable values in a pie graph
- RSS Feed
- Mark Topic as New
- Mark Topic as Read
- Float this Topic for Current User
- Bookmark
- Subscribe
- Mute
- Printer Friendly Page
- Mark as New
- Bookmark
- Subscribe
- Mute
- RSS Feed
- Permalink
- Report Inappropriate Content
Hello everyone,
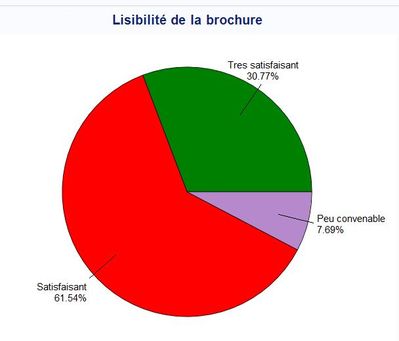
I did a survey to know what people think about my brochure. And i would like to draw a pie with their % good or bad opinion. the variable i want to draw is " Brochure " coded in 1,2,3,4. I would like to choose the color of the pie :
1 = Very good in Green
2= Good in greenyellow
3= satisfying in red
4= not satisfying in Black
SAS put me random colors... is it possible to choose each color for each value of the variable drawn in the pie please ?
Thank you, if you find me a solution 🙂
title1'Readibility of the brochure';
pattern1  color=green;
pattern2  color=greenyellow;
pattern3  color=red;
pattern4  color=black;

proc format;
   value brochure 1='Very Good'
               	            2='Good'
			    3='Satisfying'
			    4='Not Satisfying';
run;

proc gchart data=conso;
PIE brochure/ value=none
              percent=arrow
              slice=arrow
              noheading
              plabel=(font='Albany AMT/bold' h=1.3 color=depk);
			  format brochure brochure.;
run;
goptions reset=all;
These are the colors that i would like to have.

- Mark as New
- Bookmark
- Subscribe
- Mute
- RSS Feed
- Permalink
- Report Inappropriate Content
Try the symbol statement with the colour value.
- Mark as New
- Bookmark
- Subscribe
- Mute
- RSS Feed
- Permalink
- Report Inappropriate Content
You can do this with a GTL pie chart and a discrete attrmap. Here is a simple example:
proc template;
define statgraph pie;
begingraph;
discreteattrmap name="piecolors";
  value "F" / fillattrs=(color=pink);
  value "M" / fillattrs=(color=light_blue);
enddiscreteattrmap;
discreteattrvar attrvar=sex_mapped var=sex attrmap="piecolors";
layout region;
  piechart category=sex_mapped response=weight / datalabelcontent=(category percent)
           datalabelattrs=(size=20pt);
endlayout;
endgraph;
end;

proc sgrender data=sashelp.class template=pie;
run;
- Mark as New
- Bookmark
- Subscribe
- Mute
- RSS Feed
- Permalink
- Report Inappropriate Content
I would recommend pre-summarizing your data, and specifying a few extra options in your gchart (if you want the slices to start at the 12-o'clock position, and be ordered clockwise). Here is a slightly modified version of your code, and the output:
data conso;
input brochure val;
datalines;
1 .30
2 .61
3 .09
4 .00
;
run;
title1'Readibility of the brochure';
pattern1 color=green;
pattern2 color=greenyellow;
pattern3 color=red;
pattern4 color=black;
proc format;
value brochure 1='Very Good'
2='Good'
3='Satisfying'
4='Not Satisfying';
run;
proc gchart data=conso;
PIE brochure/ discrete
type=sum sumvar=val
clockwise angle=90
value=none percent=arrow slice=arrow noheading
plabel=(font='Albany AMT/bold' h=1.3 color=depk);
format brochure brochure.;
run;
April 27 – 30 | Gaylord Texan | Grapevine, Texas
Registration is open
Walk in ready to learn. Walk out ready to deliver. This is the data and AI conference you can't afford to miss.
Register now and save with the early bird rate—just $795!
Learn how use the CAT functions in SAS to join values from multiple variables into a single value.
Find more tutorials on the SAS Users YouTube channel.
SAS Training: Just a Click Away
Ready to level-up your skills? Choose your own adventure.


