- Home
- /
- Programming
- /
- Graphics
- /
- Annotate: clipping lines to plot region
- RSS Feed
- Mark Topic as New
- Mark Topic as Read
- Float this Topic for Current User
- Bookmark
- Subscribe
- Mute
- Printer Friendly Page

- Mark as New
- Bookmark
- Subscribe
- Mute
- RSS Feed
- Permalink
- Report Inappropriate Content
[Env: SAS 9.2, debian/linux]
In the custom graphic below, I want to draw a set of lines, using Annotate, with slope = -1 at the major tick marks along the X and Y axis.
(These are contours of constant influence in a multivariate regression.)
I can figure out how to draw some of these lines, but a general solution seems to require clipping lines to the plot region. This is for
a macro application, so I have to be able to figure out the plot region from the data.
Here's the code I used to draw the lines shown:
proc summary data=cookd;
var LL RR;
output out=_minmax_ min=minx miny max=maxx maxy;
proc print;
data lines;
length color function $8;
retain xsys ysys '2' color 'gray' line 2;
minx=-4; miny=-5;
do v=0, -1, -2;
x=v; y=miny; function='move'; output;
x=minx; y=v; function='draw'; output;
end;
proc print;
which produces this output:
Obs _TYPE_ _FREQ_ minx miny maxx maxy
1 0 32 -3.06549 -4.14802 0.27457 -0.22764
Obs color function xsys ysys line minx miny v x y
1 gray move 2 2 2 -4 -5 0 0 -5
2 gray draw 2 2 2 -4 -5 0 -4 0
3 gray move 2 2 2 -4 -5 -1 -1 -5
4 gray draw 2 2 2 -4 -5 -1 -4 -1
5 gray move 2 2 2 -4 -5 -2 -2 -5
6 gray draw 2 2 2 -4 -5 -2 -4 -2
Is there any code I can use for drawing more lines, but clipping them to the plot region?
thanks,
-Michael

- Mark as New
- Bookmark
- Subscribe
- Mute
- RSS Feed
- Permalink
- Report Inappropriate Content
In 9.2, I believe you can use the VECTOR statement in PROC SGPLOT to accomplish this.
See http://blogs.sas.com/content/iml/2011/06/29/add-a-diagonal-line-to-a-scatter-plot/
Instead of using a macro variable for x0 and y0 as I did in my blog, make these variables in the data set.
- Mark as New
- Bookmark
- Subscribe
- Mute
- RSS Feed
- Permalink
- Report Inappropriate Content
Thanks, Rick
Your solution is nice for the general case of one line, but I want to create a whole series of lines, all with slope -1,
which have to be clipped to the plot region, to avoid annotate errors. It would be so much easier if there was
an annotate variable, CLIP=1 which would cause this to be done internally.
I'm thinking that what I need is a macro of the form
%abline(a, b, xmin, xmax, ymin, ymax)
that would generate the proper annotate instructions for a series of {a}, all with b=-1

- Mark as New
- Bookmark
- Subscribe
- Mute
- RSS Feed
- Permalink
- Report Inappropriate Content
How about cleverly mixing & matching xsys/ysys='2' with xsys/ysys='1' (with '1' the coordinates are 0-100 inside the axes ... this will accomplish your "clipping").
For example, rather than your annotate:
data anno_lines;
length color function $8 xsys ysys $1;
color='gray';
line=2;
input function xsys ysys x y;
datalines;
move 2 2 0 -5
draw 2 2 -4 0
move 2 2 -1 -5
draw 2 2 -4 -1
move 2 2 -2 -5
draw 2 2 -4 -2
;
run;
I'd recommend using an annotate like this:
(note the xsys/ysys='1' coordinates)
data anno_lines2;
length color function $8 xsys ysys $1;
color='gray';
line=2;
input function xsys ysys x y;
datalines;
move 2 1 0 0
draw 1 2 0 0
move 2 1 -1 0
draw 1 2 0 -1
move 2 1 -2 0
draw 1 2 0 -2
;
run;
data foo;
x=-1; y=-2; size=1; output;
run;
axis1 order=(-5 to 0 by 1) minor=none offset=(0,0);
axis2 order=(-4 to 1 by 1) minor=none offset=(0,0);
proc gplot data=foo anno=anno_lines2;
bubble y*x=size / vaxis=axis1 haxis=axis2;
run;
- Mark as New
- Bookmark
- Subscribe
- Mute
- RSS Feed
- Permalink
- Report Inappropriate Content
Hi Rob
Your solution works for the three lines I showed on my graph, but I don't think it generalizes to other lines for values of
X > xmax. I tried adding one more line, corresponding to a line from (1, 0) to (0,1). But that generates an annotate
error.
data anno_lines2;
length color function $8 xsys ysys $1;
color='gray';
line=2;
input function xsys ysys x y;
datalines;
move 2 1 0 0
draw 1 2 0 0
move 2 1 -1 0
draw 1 2 0 -1
move 2 1 -2 0
draw 1 2 0 -2
move 2 1 1 0
draw 1 2 0 1
;
run;
data foo;
x=-1; y=-2; size=1; output;
x=-2; y=-1; size=0.5; output;
run;
axis1 order=(-5 to 0 by 1) minor=none offset=(0,0);
axis2 order=(-4 to 1 by 1) minor=none offset=(0,0);
proc gplot data=foo anno=anno_lines2;
bubble y*x=size / vaxis=axis1 haxis=axis2;
run;
- Mark as New
- Bookmark
- Subscribe
- Mute
- RSS Feed
- Permalink
- Report Inappropriate Content
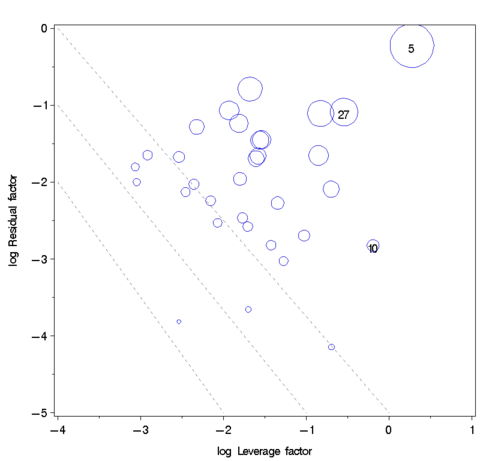
For what its worth, below is a completed, correct version of the plot I'm trying to make, with all
diagonal lines with slope=-1. As I mentioned initially, these show contour lines of equal
multivariate influence (Cook's D), which is also portrayed by bubble size.

The code I'm currently using for these diagonal lines is below. I'm loloking for
a way to generalize this to the case where the plot boundaries can be different,
but always lines at integer values of (x,y) with slopes = -1.
data lines;
length color function $8;
retain xsys ysys '2' color 'gray' line 2 when 'B';
minx=-4; miny=-5; maxx=1; maxy=0;
drop minx miny maxx maxy v;
*-- lines with slope = -1;
do v=-3 to 1 by 1;
x=v; y=miny; function='move'; output;
x=minx; y=v-(minx-miny); function='draw'; output;
end;
*-- add a few more lines that go beyond the plot boundaries;
x = 1; y = -4; function='move'; output;
x = -3; y = 0; function='draw'; output;
x = 1; y = -3; function='move'; output;
x = -2; y = 0; function='draw'; output;
x = 1; y = -2; function='move'; output;
x = -1; y = 0; function='draw'; output;
x = 1; y = -1; function='move'; output;
x = 0; y = 0; function='draw'; output;
proc print;
Obs color function xsys ysys line when x y
1 gray move 2 2 2 B -3 -5
2 gray draw 2 2 2 B -4 -4
3 gray move 2 2 2 B -2 -5
4 gray draw 2 2 2 B -4 -3
5 gray move 2 2 2 B -1 -5
6 gray draw 2 2 2 B -4 -2
7 gray move 2 2 2 B 0 -5
8 gray draw 2 2 2 B -4 -1
9 gray move 2 2 2 B 1 -5
10 gray draw 2 2 2 B -4 0
11 gray move 2 2 2 B 1 -4
12 gray draw 2 2 2 B -3 0
13 gray move 2 2 2 B 1 -3
14 gray draw 2 2 2 B -2 0
15 gray move 2 2 2 B 1 -2
16 gray draw 2 2 2 B -1 0
17 gray move 2 2 2 B 1 -1
18 gray draw 2 2 2 B 0 0
- Mark as New
- Bookmark
- Subscribe
- Mute
- RSS Feed
- Permalink
- Report Inappropriate Content
Hmm ... yeah, I think you're going to have to calculate where the lines intercept the axes, and use those points.
There might be another more easy/clever way to do it, but nothing comes to mind ![]()
.jpg")
Catch up on SAS Innovate 2026
Nearly 200 sessions are now available on demand in the Innovate Hub.
Watch Now →Learn how use the CAT functions in SAS to join values from multiple variables into a single value.

Find more tutorials on the SAS Users YouTube channel.
SAS Training: Just a Click Away
Ready to level-up your skills? Choose your own adventure.
-
6 replies
-
01-17-2012 10:24 AM
-
4387 views
-
0 likes
-
3 in conversation
-
