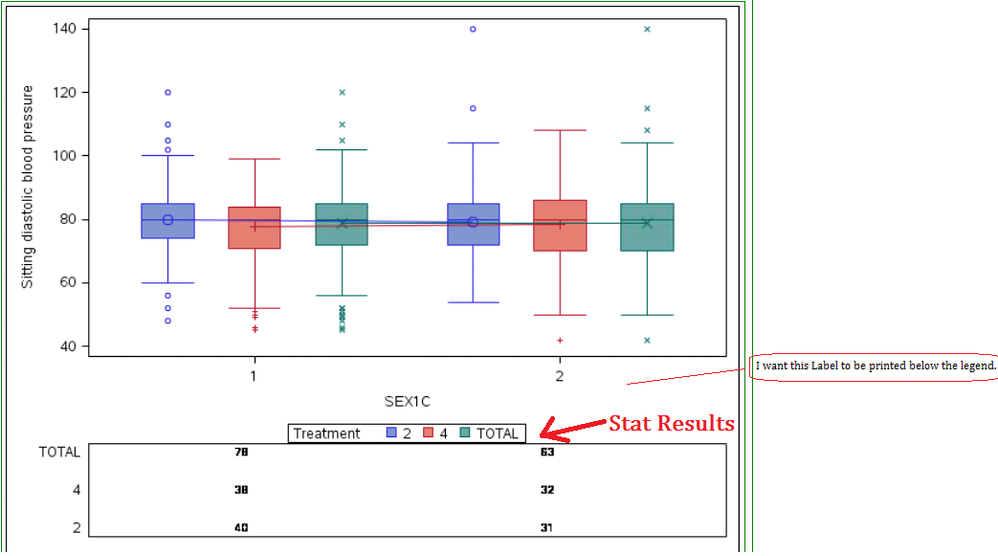
Hi, I am using the below template to generate graph for my requirement, I want to insert a header to the second layout(PFA attached screenshot). Please help to Insert a text box or cell for providing a title Note: I used Entrytitle but it shows for the First graph(ie. for boxplot). Proc Template; define statgraph Tflboxplot/store=util.template; notes "Template for boxplot"; dynamic _byline_; begingraph /; layout lattice / rowweights=(0.8 .01 .19); layout overlay / xaxisopts=(display=(LINE TICKVALUES TICKS LABEL) griddisplay=OFF) yaxisopts=(display=(LINE TICKVALUES TICKS LABEL) griddisplay=OFF); BoxPlot X=SEX1C Y=STNDBP1N / name="boxplot" group=TRTREG1C GROUPDISPLAY=CLUSTER display=(CAPS FILL MEAN MEDIAN OUTLIERS connect) connect=MEAN DATALABEL=OUTLIER_LABLE INCLUDEMISSINGGROUP=1 LABELFAR=0 CAPSHAPE= LINE DATATRANSPARENCY=0 GROUPORDER=DATA BOXWIDTH=0.6 CLUSTERWIDTH=0.85 intervalboxwidth=AUTO; discretelegend "boxplot" / title="Treatment " location=OUTSIDE border=ON; endlayout; layout overlay / xaxisopts=(display=(LINE) griddisplay=OFF) yaxisopts=(offsetmin=0.10 offsetmax=0.10 display=( LINE TICKVALUES) griddisplay=OFF); scatterplot x=SEX1C y=TRTREG1C / name="boxplot_" DATALABEL=N INCLUDEMISSINGGROUP=1 DATATRANSPARENCY=0 GROUPORDER=DATA CLUSTERWIDTH=0.85 DATALABELPOSITION=LEFT MARKERATTRS=(size=0); endlayout; endlayout; endgraph; end; Run;