The U.S. Women’s national team made history by becoming the first to win three FIFA Women’s World Cup titles, defeating defending champion Japan in a 5-2 victory. The star of the final match, attacking midfielder Carli Lloyd, scored three of the four goals in the first 16 minutes – the most impressive being a 54-yard strike behind the halfway line.
As the U.S. Women’s team completed the tournament on such a stunning note, we took a closer look at its strategy throughout the event, and have illustrated it in SAS Visual Analytics -- see below animated bubble plot. Here’s the play-by-play (pun intended).
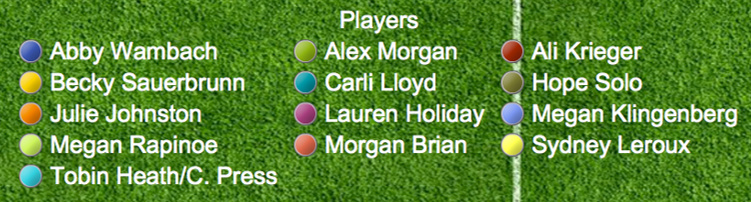
Of note is the fact that Lloyd wasn’t always on the attacking end of the field. For the first few games, the U.S. held a 4-4-2 player lineup with different pairings of two forwards like Abby Wambach (Indigo) with Sydney Leroux (Light Yellow), and Wambach with Alex Morgan (Lime Green). Lloyd (Turquoise) and Lauren Holiday (Purple) were central midfielders.
But starting with the semifinal against Germany, various observers noted that Coach Jill Ellis seemed to switch the lineup to a 4-2-3-1 formation, where Morgan Brian (Pink) displayed her defensive techniques as center midfielder, and Lloyd (Turquoise) was able to position herself farther up the field between the opposing midfield and defensive lines. In the chart, you'll see the Brian "dot" appear in the center as of the quarterfinal game against China, and she continued this position in the semi and final games.
This dramatic change in lineup -- replacing Wambach and Leroux with forward Alex Morgan and Lloyd as an attacking midfielder or secondary striker -- proved to be successful. Morgan made runs that pulled defenders with her, creating more space for Lloyd to attack. Brian, the youngest U.S. player at age 22, held a strong midfield position alongside Lauren Holiday.
This is our evaluation of the US Women's team strategy; now it's your turn. What do you think? Was the shift critical for the U.S. to claim the title? How about this SAS Visual Analytics animation -- do you see this visualization technique being useful to your organization? Check out this article detailing how we created this graph, as part of the custom graph series.

This article was co-written by SAS' Meredith Bailey and I-Kong Fu.
.jpg")
