If you’re in a marketing or customer service role, no doubt a major piece of your reporting puzzle includes analyzing social media interactions. Say you’re preparing for an upcoming meeting with your manager and you’d like to report on customer service levels using data from call centers and social media channels – all in a cohesive dashboard. In addition to Twitter feeds and other data, you can now analyze Facebook with the newly released SAS Visual Analytics 7.2.
Facebook conversations often reveal quite a few details on customer service interactions. For example, you can analyze company representative replies to customer complaints through the specific, targeted conversations. On the other hand, Twitter may uncover talk of categories of companies in general, with less elaboration. Nonetheless, having both data streams available for analyzing and visualizing in SAS Visual Analytics 7.2 will give you an even bigger picture of customer service and digital marketing efforts.
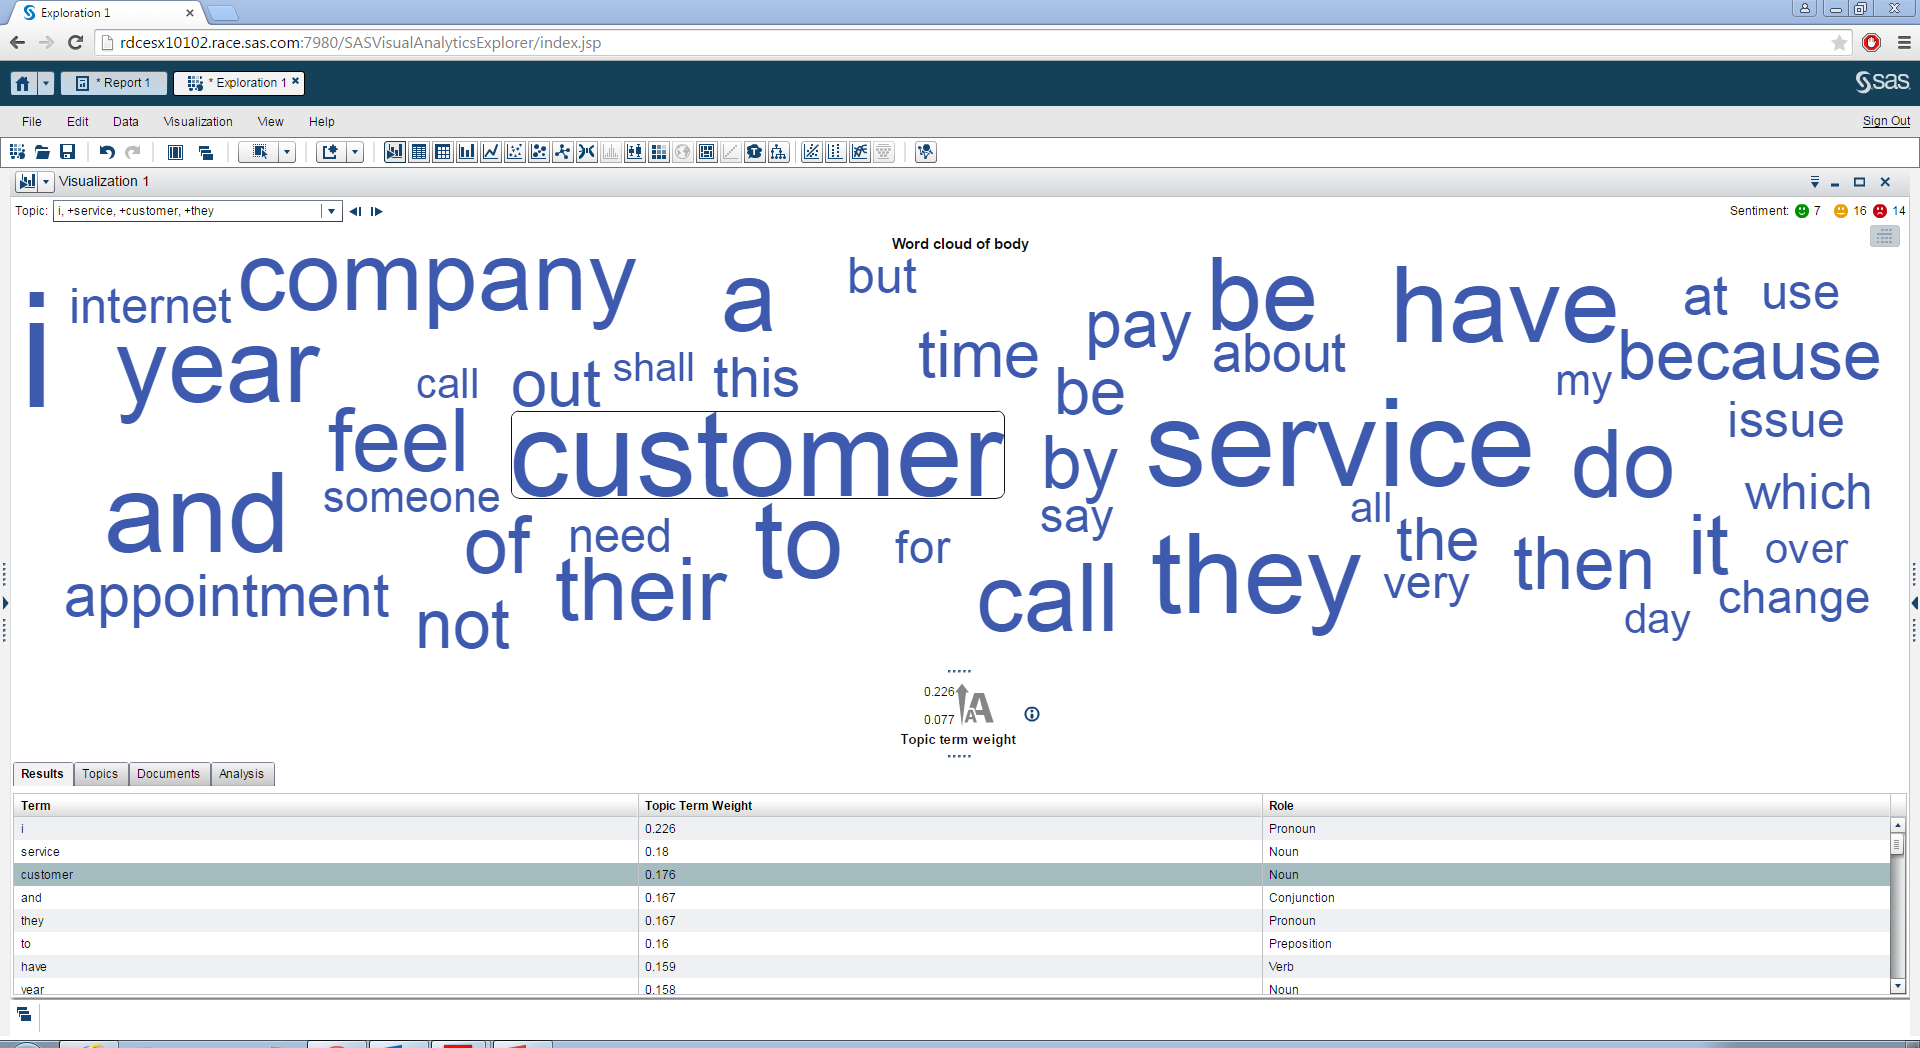
You can perform a sentiment analysis of your organization’s Facebook page via a word cloud, for example. Or track volume of web traffic in a line chart. SAS Visual Analytics will automatically group topics people are talking about, and monitor engagement metrics such as ‘likes’ and ‘shares.’
Here’s some sample Facebook data in a word cloud:
(click to enlarge)
How will the ability to integrate Facebook enrich your reports? Comment with thoughts! And get the scoop on more SAS Visual Analytics 7.2 features.

