- Home
- /
- Programming
- /
- SAS Procedures
- /
- proc tabulate percentage and difference between two variable
- RSS Feed
- Mark Topic as New
- Mark Topic as Read
- Float this Topic for Current User
- Bookmark
- Subscribe
- Mute
- Printer Friendly Page

- Mark as New
- Bookmark
- Subscribe
- Mute
- RSS Feed
- Permalink
- Report Inappropriate Content
Noone has an idea?
Hi, i have a code with proc tabulate. i need to develop and add something like below:
data a;
input campus $ id $ year $ gender $ ;
datalines;
Ocala 22 2013 F
Ocala 22 2014 F
West 35 2013 F
West 35 2014 F
West 35 2015 F
West 38 2014 M
East 48 2014 -
East 55 2013 F
East 55 2014 F
;
run;
proc tabulate data=a;
class campus year gender/missing;
table (all='Total' gender ALL ), campus=''*year='' *n='';
run;
What i need is first all campus, then West campus then East campus. I don't need Ocala campus.
Other think i need is 2014 total and %tot 2014(percent).
Other think i need is 2014- 2015 and difference 2014 to 2015.
Let me show the output i am trying to achieve:
| east | west | |||||||||||||
| 2014 | percent2014 | 2015 | percent2015 | difference2014-2015 | percent difference2014-2015 | 2014 | percent2014 | 2015 | percent2015 | difference2014-2015 | percent difference2014-2015 | |||
| total | 2 | %100 | 1 | %100 | 1 | %100 | 2 | %100 | 2 | %100 | 0 | |||
| gender | ||||||||||||||
| female | 1 | %50 | - | %0 | 1 | %100 | 1 | %50 | 1 | %50 | 0 | |||
| male | - | %0 | - | %0 | 00 | %0 | 1 | %50 | 1 | %50 | 0 | |||
| none | 1 | %50 | 1 | %100 | 0 | %0 | 0 | %0 | 0 | %0 | 0 | |||
- Mark as New
- Bookmark
- Subscribe
- Mute
- RSS Feed
- Permalink
- Report Inappropriate Content
I clicked on assumed answered mistakenly. But didn't. Any suggestion?

- Mark as New
- Bookmark
- Subscribe
- Mute
- RSS Feed
- Permalink
- Report Inappropriate Content
If you need difference then Proc Tabulate will not do that in the procedure. You could presummarize the data but Proc Report would be where to do column differences.
Also when discussing Proc Tabulate and percentages you need to be specific as to what the denominator and numerator should be as well as if you are looking for a PCTN or PCTSUM (and the row, column or table versions).
Use a where statement or a where dataset option to remove the Ocala records:
proc tabulate data=a;
where campus ne 'Ocala';
...
or
proc tabulate data=a (where=(campus ne 'Ocala'));
class ...
- Mark as New
- Bookmark
- Subscribe
- Mute
- RSS Feed
- Permalink
- Report Inappropriate Content
Hi ballardw, thanks for respond. I added example table. It should be like below:
| east | west | |||||||||||||
| 2014 | percent2014 | 2015 | percent2015 | difference2014-2015 | percent difference2014-2015 | 2014 | percent2014 | 2015 | percent2015 | difference2014-2015 | percent difference2014-2015 | |||
| total | ||||||||||||||
| gender | ||||||||||||||
| female | ||||||||||||||
| male | ||||||||||||||
| none | ||||||||||||||
Can i do all of them with only proc report? If it is can you give me an example? I need difference and percent together like here.
- Mark as New
- Bookmark
- Subscribe
- Mute
- RSS Feed
- Permalink
- Report Inappropriate Content
For Percent calculations you still need to specify what the denominator and numerator you are looking for may be. Provide a bit of example data and the corresponding result in the table.
- Mark as New
- Bookmark
- Subscribe
- Mute
- RSS Feed
- Permalink
- Report Inappropriate Content
data a;
input campus $ id $ year $ gender $ ;
datalines;
  West 35 2013 F
  West 35 2014 F
  West 35 2015 F
  West 38 2014 M
  West 38 2015 M
  East 48 2014 -
  East 48 2015 -
  East 55 2013 F
  East 55 2014 F
;
run;
| east | west | |||||||||||||
| 2014 | percent2014 | 2015 | percent2015 | difference2014-2015 | percent difference2014-2015 | 2014 | percent2014 | 2015 | percent2015 | difference2014-2015 | percent difference2014-2015 | |||
| total | 2 | %100 | 1 | %100 | 1 | %100 | 2 | %100 | 2 | %100 | 0 | |||
| gender | ||||||||||||||
| female | 1 | %50 | - | %0 | 1 | %100 | 1 | %50 | 1 | %50 | 0 | |||
| male | - | %0 | - | %0 | 00 | %0 | 1 | %50 | 1 | %50 | 0 | |||
| none | 1 | %50 | 1 | %100 | 0 | %0 | 0 | %0 | 0 | %0 | 0 | |||

- Mark as New
- Bookmark
- Subscribe
- Mute
- RSS Feed
- Permalink
- Report Inappropriate Content
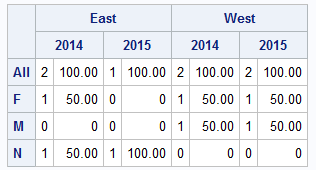
This gives you the percentages you want. proc tabulate does not do differences.
data A;
input CAMPUS $ ID $ YEAR GENDER $ ;
datalines;
West 35 2013 F
West 35 2014 F
West 35 2015 F
West 38 2014 M
West 38 2015 M
East 48 2014 N
East 48 2015 N
East 55 2013 F
East 55 2014 F
run;
option missing=0;
proc tabulate data=A;
where YEAR ne 2013;
class GENDER CAMPUS YEAR;
table all GENDER=' ',CAMPUS=' '*YEAR=' '*(N=' ' pctn<all GENDER>=' ') ;
run;
- Mark as New
- Bookmark
- Subscribe
- Mute
- RSS Feed
- Permalink
- Report Inappropriate Content
Morning ballardw. I added numbers tot he example table. Do you think it is possible to make it?

Available on demand!
Missed SAS Innovate Las Vegas? Watch all the action for free! View the keynotes, general sessions and 22 breakouts on demand.
Learn the difference between classical and Bayesian statistical approaches and see a few PROC examples to perform Bayesian analysis in this video.

Find more tutorials on the SAS Users YouTube channel.
 Click image to register for webinar
Classroom Training Available!
Select SAS Training centers are offering in-person courses. View upcoming courses for:
-
7 replies
-
07-28-2015 09:31 AM
-
4571 views
-
1 like
-
3 in conversation
-
