- Home
- /
- Programming
- /
- SAS Procedures
- /
- how to get one boxplot with several identical variables for two groups
- RSS Feed
- Mark Topic as New
- Mark Topic as Read
- Float this Topic for Current User
- Bookmark
- Subscribe
- Mute
- Printer Friendly Page
- Mark as New
- Bookmark
- Subscribe
- Mute
- RSS Feed
- Permalink
- Report Inappropriate Content
hey all,
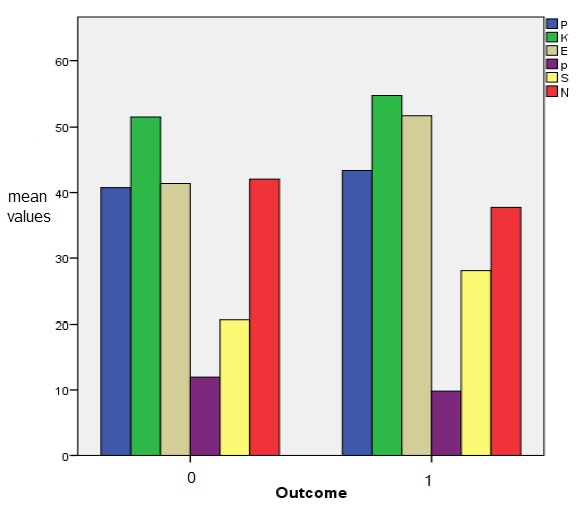
I want to get a plot like the following but with boxplots instead of bars:

So I have 2 outcome groups and 6 identical variables per group.
I tried several syntax codes but I could not handle to get all this in one graphic. And I also tried different orderings of variables. But the BY statement only produces several pics that I don't want and in the PLOT statement it is not possible to put 3 variables like outcome * variable * valuesOfVariable.
I found something like valuesOfVariable*Variable=Outcome, but this did not work, too.
Does someone have an idea?
greetings, Eski
- Mark as New
- Bookmark
- Subscribe
- Mute
- RSS Feed
- Permalink
- Report Inappropriate Content
You may need to restructure data as the SAS graphing procedures tend to prefer one variable to tell which group of data is summarized/displayed and values associated with that grouping variable.
You might also look at sgpanel and create a separate graph for the levels of your outcome variable.
Available on demand!
Missed SAS Innovate Las Vegas? Watch all the action for free! View the keynotes, general sessions and 22 breakouts on demand.
Learn the difference between classical and Bayesian statistical approaches and see a few PROC examples to perform Bayesian analysis in this video.
Find more tutorials on the SAS Users YouTube channel.
 Click image to register for webinar
Classroom Training Available!
Select SAS Training centers are offering in-person courses. View upcoming courses for:


