- Home
- /
- Programming
- /
- Graphics
- /
- Re: need separate legend values for bars and lines in a clustered bar/...
- RSS Feed
- Mark Topic as New
- Mark Topic as Read
- Float this Topic for Current User
- Bookmark
- Subscribe
- Mute
- Printer Friendly Page

- Mark as New
- Bookmark
- Subscribe
- Mute
- RSS Feed
- Permalink
- Report Inappropriate Content
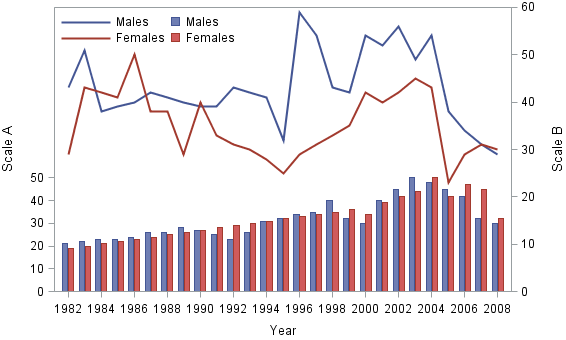
Greetings from Australia. I have been asked by someone in my organisation to produce a 'grouped' bar/line (which I have done - see above).
Everything about it is good except that I can't work out how to change the legend label values.
We need the line legend values to be 'Males Scale B' and 'Females Scale B'
and the bar values to be 'Males Scale A' and 'Females Scale A'.
At present having the same legend for both will not be useful.
I'm hoping that we don't have to start again and use GTL since the code below has got us so close.......
Any advice appreciated.
(We are using SAS 9.3).
Thanks!
format;
value sexfmt
1='Males'
2='Females';
;
sgplot data=temp pad=(top=0 bottom=0 left=0 right=0);
vbar year / response=barval group=sex groupdisplay=cluster barwidth=0.85 clusterwidth=0.7 name="bars";
vline year / response=lineval group=sex y2axis name="lines" lineattrs=(thickness=2);
y2axis min=0 max=60 offsetmin=0 offsetmax=0 label='Scale B' ;
yaxis min=0 max=50 offsetmin=0 offsetmax=0.6 label='Scale A'; /***offset max says use 0.6 (60% of the axis as an offset)***/
xaxis fitpolicy=thin label='Year';
keylegend "lines" "bars"/ noborder down=2 location=inside position=topleft;
format sex sexfmt.;

- Mark as New
- Bookmark
- Subscribe
- Mute
- RSS Feed
- Permalink
- Report Inappropriate Content
Since the colors you are using represent the same thing, gender, I would be tempted to only display one of the legends in the KEYLEGEND statement and add a title to keylegend that would indicate look at scale A for bar and scale B for line values.

- Mark as New
- Bookmark
- Subscribe
- Mute
- RSS Feed
- Permalink
- Report Inappropriate Content
Another possibility would be to put the bar chart and line chart content in separate legends. Position the bar chart legend at the outside/bottom-left and the line chart legend at the outside/bottom-right. Title each legend "Scale A" and "Scale B" appropriately. The legend proximity to the correct axis and the legend title should help create the correct association.
Hope this helps!
Dan

Available on demand!
Missed SAS Innovate Las Vegas? Watch all the action for free! View the keynotes, general sessions and 22 breakouts on demand.
Learn how use the CAT functions in SAS to join values from multiple variables into a single value.

Find more tutorials on the SAS Users YouTube channel.
 Click image to register for webinar
Classroom Training Available!
Select SAS Training centers are offering in-person courses. View upcoming courses for:
-
2 replies
-
08-12-2013 02:36 AM
-
1264 views
-
0 likes
-
3 in conversation
-
