- Home
- /
- Programming
- /
- Graphics
- /
- Pies with Horizontal Data
- RSS Feed
- Mark Topic as New
- Mark Topic as Read
- Float this Topic for Current User
- Bookmark
- Subscribe
- Mute
- Printer Friendly Page

- Mark as New
- Bookmark
- Subscribe
- Mute
- RSS Feed
- Permalink
- Report Inappropriate Content
I would like to create a pie chart with data that exist in the following format. How can SAS do it? I have looked into the GChart procedure, but it looks like my data need to be in the format below the graph to be able to work... Any ideas?
Data that I have:
| A | B | C |
| 5 | 4 | 6 |
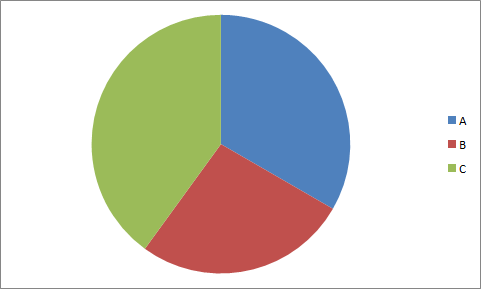
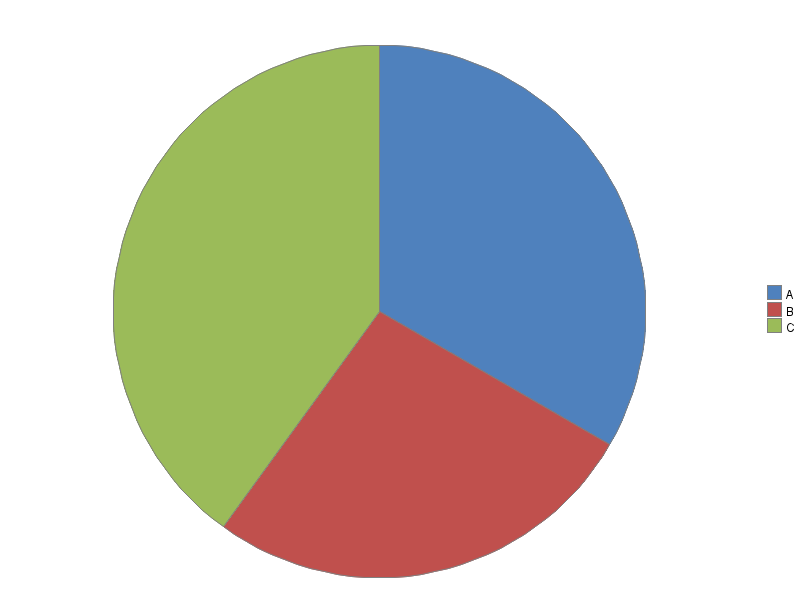
Chart that I need:
Data that Proc GChart needs to produce a pie:
| A |
| A |
| A |
| A |
| A |
| B |
| B |
| B |
| B |
| C |
| C |
| C |
| C |
| C |
| C |
Accepted Solutions

- Mark as New
- Bookmark
- Subscribe
- Mute
- RSS Feed
- Permalink
- Report Inappropriate Content
Here's how to create a pie chart like that with Gchart ...
data my_data;
input slice_var $1 quantity;
datalines;
A 5
B 4
C 6
;
run;
legend1 label=none across=1 position=(right middle) shape=bar(.15in,.15in);
pattern1 v=s c=cx4f81bd;
pattern2 v=s c=cxc0504d;
pattern3 v=s c=cx9bbb59;
proc gchart data=my_data;
pie slice_var / type=sum sumvar=quantity
noheader coutline=gray legend=legend1
angle=90 clockwise;
run;
- Mark as New
- Bookmark
- Subscribe
- Mute
- RSS Feed
- Permalink
- Report Inappropriate Content
You might also find my Pie Chart tutorial useful! ![]()
http://blogs.sas.com/content/sastraining/2013/09/17/a-beginners-tutorial-on-pie-charts/
- Mark as New
- Bookmark
- Subscribe
- Mute
- RSS Feed
- Permalink
- Report Inappropriate Content
Awesome!
Thank you ![]()

Available on demand!
Missed SAS Innovate Las Vegas? Watch all the action for free! View the keynotes, general sessions and 22 breakouts on demand.
Learn how use the CAT functions in SAS to join values from multiple variables into a single value.

Find more tutorials on the SAS Users YouTube channel.
 Click image to register for webinar
Classroom Training Available!
Select SAS Training centers are offering in-person courses. View upcoming courses for:
-
3 replies
-
10-01-2013 03:52 PM
-
974 views
-
3 likes
-
2 in conversation
-
