- Home
- /
- Programming
- /
- Graphics
- /
- Help with Vaxis scale adjustment within proc univariate - histogram
- RSS Feed
- Mark Topic as New
- Mark Topic as Read
- Float this Topic for Current User
- Bookmark
- Subscribe
- Mute
- Printer Friendly Page

- Mark as New
- Bookmark
- Subscribe
- Mute
- RSS Feed
- Permalink
- Report Inappropriate Content
I cant seem to manually adjust the Vertical axis scale. I want it to be 0 to 50 by 10. Here is my code. Can anyone help?
With ods graphics on, the vaxis option within the histogram statement doesn't work.
Thanks,
-Adam
define style noframe;
parent=styles.journal;
style graphwalls from graphwalls / frameborder=off;
end;
run;
ods rtf image_dpi=300;
ods graphics on;
ods rtf file = "C:\Users\Adam Bress\Dropbox\CYP11b2 Analysis\NCESTEY.rtf" style=noframe;
proc univariate data=c;
var na ;
histogram na / midpoints = 0 to 1 by .1 noframe cfill=grey font=arial vaxis= 0 to 50 by 10 ;
run;
ods rtf close;
- Mark as New
- Bookmark
- Subscribe
- Mute
- RSS Feed
- Permalink
- Report Inappropriate Content
I'm using version 9.2

- Mark as New
- Bookmark
- Subscribe
- Mute
- RSS Feed
- Permalink
- Report Inappropriate Content
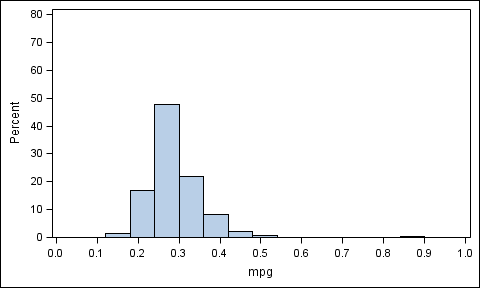
Per the SAS 9.3 log message, the procedure wants the range you provide should cover the range of the data. I don't see your data attached, so I just made up one. Since (in my test case) the max value needed for Y is 57, I have to increase my setting. Here is the program. I don't have access to SAS 9.2 right now, so give it a try.
proc template;
define style noframe;
parent=styles.journal;
style graphwalls from graphwalls / frameborder=off;
end;
run;
ods html close;
ods rtf image_dpi=300;
data cars;
set sashelp.cars;
mpg=mpg_city/70;
run;
ods graphics on;
ods rtf file = "C:\NCESTEY.rtf" style=noframe;
proc univariate data=cars;
var mpg ;
histogram mpg / midpoints = 0 to 1 by .1 noframe cfill=grey font=arial vaxis= 0 to 60 by 10 ;
run;
ods rtf close
- Mark as New
- Bookmark
- Subscribe
- Mute
- RSS Feed
- Permalink
- Report Inappropriate Content
Thanks for the reply!
The issue here, is with you example, im unable to change the vscale to 0 to 80. or something like that? The vaxis scale on the figure remains from 0 to 60.
proc template;
define style noframe;
parent=styles.journal;
style graphwalls from graphwalls / frameborder=off;
end;
run;
ods html close;
ods rtf image_dpi=300;
data cars;
set sashelp.cars;
mpg=mpg_city/70;
run;
ods graphics on;
ods rtf file = "C:\NCESTEY.rtf" style=noframe;
proc univariate data=cars;
var mpg ;
histogram mpg / midpoints = 0 to 1 by .1 noframe cfill=grey font=arial vaxis= 0 to 80 by 10 ;
run;
ods rtf close
- Mark as New
- Bookmark
- Subscribe
- Mute
- RSS Feed
- Permalink
- Report Inappropriate Content
This is because by default, in GTL (the graphing system behind the scene here) the axis range you provide is a HINT, not a requirement. GTL will use the spacing you provide, but will still only draw an axis range that is in the data. You can change that, but it is not clear to me (yet) if this option is exposed in the UNIVARIATE HISTOGRAM statement.
I do know that you can create a simple Histogram using the SGPLOT procedure to get exactly what you want. The option to force your data range is ON by default. This will work with SAS 9.2.
data cars;
set sashelp.cars;
mpg=mpg_city/70;
run;
proc sgplot data=cars;
histogram mpg;
yaxis values=(0 to 80 by 10);
xaxis values=(0 to 1 by 0.1);
run;

- Mark as New
- Bookmark
- Subscribe
- Mute
- RSS Feed
- Permalink
- Report Inappropriate Content
Dear Sanjay,
I am in this same predicament. You say it is possible to override the default GTL in proc univariate to produce the yaxis range you specify in the vaxis statement.
What are the steps to do that?
My highest data value is 9 but to standardize the yaxis to other histograms in the document for different weeks for comparrision I need the scale to extend to 14 . Here vaxis is simply ignored. How do I get proc univariate to pay attention to it?
Thank you.
proc univariate data=ppn3 noprint;
histogram oediff4/
normal
midpoints=-44 to 20 by 1
CFILL = ltgray
ctext=blue
VSCALE=COUNT
VAXISLABEL = "Number of Households"
VREF=(0 to 14 by 2)
BARLABEL=COUNT
odstitle= "Distribution of Stock";
run;

Available on demand!
Missed SAS Innovate Las Vegas? Watch all the action for free! View the keynotes, general sessions and 22 breakouts on demand.
Learn how use the CAT functions in SAS to join values from multiple variables into a single value.

Find more tutorials on the SAS Users YouTube channel.
 Click image to register for webinar
Classroom Training Available!
Select SAS Training centers are offering in-person courses. View upcoming courses for:
-
5 replies
-
02-28-2013 11:12 AM
-
2347 views
-
0 likes
-
3 in conversation
-
