- Home
- /
- SAS Communities Library
- /
- What is the shortest tour that visits only once the 48 contiguous US S...
- RSS Feed
- Mark as New
- Mark as Read
- Bookmark
- Subscribe
- Printer Friendly Page
- Report Inappropriate Content
What is the shortest tour that visits only once the 48 contiguous US State Capitals?
- Article History
- RSS Feed
- Mark as New
- Mark as Read
- Bookmark
- Subscribe
- Printer Friendly Page
- Report Inappropriate Content
In this article, I use SAS Optimization 8.3 to find a tour through the 48 contiguous US state capitals plus Washington, D.C. by solving the well-known Traveling Salesman Problem: Given a set of connected cities, what is the shortest route that visits every city once and returns to the starting place?
The results of the Optimization are easily displayed in a beautiful USA topographical map in Visual Analytics that shows the order each US state capital is visited in the tour.
SAS Optimization 8.3 in Viya 3.4 provides both general optimization and network optimization procedures that take advantage of the distributed, cloud-based computational environment that SAS Viya provides. Examples of those procedures will be the topic of future articles.
The Traveling Salesman Problem
In the optimization world, this is a well-known problem, easily stated and difficult to solve: Given a set of connected cities, what is the shortest route that visits every city once and returns to the starting place? There are many applications of this problem, for example: routing vehicles, drilling holes in circuit boards, scheduling tasks, etc.
Imagine you are a salesman who must visit 5 cities, in how many ways you could visit those 5 cities once building a tour? Now imagine that you must visit 10 cities … you can figure out that the number of ways is (n-1)! which means that for 10 cities there are 362,880 permutations, for 15 cities the permutations surpass 87 billion. For this tour example, the correct formula is (n-1)!/2 because the graph is undirected, that is, there is not a definite direction for the tour. For example, from Sacramento, CA, we could travel to either Carson City, NV or to Salem, OR.
Optimization algorithms are used to solve this type of problem.
The mathematical description of the problem is provided in the Appendix.
SAS Viya
It is the SAS platform that enables customers to develop, deploy, and manage using a single platform throughout the Analytics Lifecycle. The underlying engine is called CAS; which stands for Cloud Analytic Services.
A CAS Action is the smallest unit of functionality in CAS. You can submit a CAS action though a variety of clients, such as PROC CAS via SAS Studio, or through similar syntax in Python, Java, or Lua. A CAS Action Set is a collection of actions (tasks) that group functionality: for example, session management, table management, Text Mining, Optimization, Network Optimization, etc.
Action Sets and Actions are important because the same Action Sets and Actions are used no matter the client used to make the request. This example is demonstrated using CASL, but you could just as easily use Python or Java.
CAS Procedures are executed from a SAS client, such as SAS Studio 5.1, and provide a wrapper around a CAS action or action set to perform task(s) in the server. I programmed the Network Optimization Actions in SAS Studio 5.1. The code is interesting because it shows how to work with CASL using the new optNetwork action set, in particular the action optNetwork.tsp. The tsp action uses only one core on a single machine.
SAS® Studio 5.1 is a SAS developer environment that fully integrates with other Viya components (microservices architecture, SAS Drive, SAS Launcher Server/Service and SAS Compute Server/Service, etc.). It is available only with full deployments. For more details, see One, Two, Three SAS Studio! Enter SAS Studio 5.
SAS Optimization 8.3 in Viya 3.4
SAS Optimization 8.3 provides improvements to its procedures, optimization solvers, and CAS actions. Improvements with respect to SAS Optimization 8.2 are significant in performance and memory consumption. Optimization solvers are provided for linear (LP), mixed integer linear (MILP), quadratic (QP), nonlinear (NLP), network, local search (LSO), and constraint logic programming (CLP) problems.
SAS Optimization 8.3 has two Action Sets: Optimization and Network Optimization.
The Network Optimization Action Set “includes a number of graph theory and network optimization algorithms that can augment more generic mathematical optimization approaches. Many practical applications of optimization depend on an underlying network. For example, retailers face the problem of shipping goods from warehouses to stores in a distribution network to satisfy demand at minimum cost. Commuters choose routes in a road network to travel from home to work in the shortest amount of time. Networks also appear explicitly and implicitly in many other application contexts.” See SAS® 9.4 and SAS® Viya® 3.4 Programming Documentation /Network Optimization Programming Guide
In this post, I used the tsp Action, whose formal description is: “the goal is to find a Hamiltonian cycle of minimum total cost, where the total cost is the sum of the costs of the links in the tour.” I use the tsp action to find a tour through the 48 contiguous USA state capitals plus Washington, D.C.
Code
/* Start a cas session */
cas mySession sessopts=(caslib=CASUSER timeout=1800 locale="en_US" metrics=true);
caslib _all_ assign;

/* Get a list of the state capital cities (with latitude and longitude) */
proc sql;
create table Cities as
select unique statecode as state, city, lat, long
from maps.uscity
where capital='Y' and statecode not in ('AK' 'PR' 'HI');
quit;

/* Create a list of all the possible pairs of cities */
proc sql;
create table CitiesDist as
select
a.city as from, a.lat as lat1, a.long as long1,
b.city as to, b.lat as lat2, b.long as long2,
geodist(lat1, long1, lat2, long2, 'DM') as weight
from Cities as a, Cities as b
where a.city < b.city;
quit;

data casuser.CitiesDist;
set CitiesDist;
run;

proc cas;
	loadactionset "optNetwork";
	action optNetwork.tsp result=r status=s /
      	indexOffset = 1
		links = {name = "CitiesDist"}
		outNodes = {name= "TSPTour", replace=true};
run;
   print r.ProblemSummary; run;
   print r.SolutionSummary; run;

   action table.fetch / table = "TSPTour" sortBy = "tsp_order"; run;
quit;

/* Merge latitude and longitude for the cities in the Hamiltonian tour */
proc sql;
create table TSPTourLinksAnno_1 as
select  a.node as from, tsp_order as order, cities.lat as lat_from, -1 * cities.long as long_from
from casuser.TSPTour as a left join cities as b
on a.node=b.city;

proc sql;
create table TSPTourLinksAnno_2 as
select  a.from as to, a.order -1  as new_order, cities.lat as lat_to, -1 * cities.long as long_to
from TSPTourLinksAnno_1 as a left join cities as b
on a.from=b.city;

/* Close the tour, that is, add a row so that the last city in the tour pairs to the first city */
data tempOne;
set TSPTourLinksAnno_2;
if new_order = 0 then new_order = 49;
run;

proc sql;
create table TSPTourGeoOne as
select  TSPTourLinksAnno_1.*, tempOne.*
from TSPTourLinksAnno_1 as a, tempOne as b
where a.order=b.new_order;
quit;

proc sort data=TSPTourGeoOne out=CASUSER.TSPTourGeo_VA (drop=new_order );
by order;
run;

/* Promote the table with the Hamiltonian tour to use it in Visual Analytics */
/* These two instructions only need to run once. Once the table is promoted, we don't need to promote it again */

libname ANALYTIC cas caslib="ANALYTICS";

proc casutil outcaslib="ANALYTIC";
	promote casdata="TSPTourGeo_VA";
quit;run;

proc casutil;
	list tables incaslib="ANALYTIC";
run;
These are the main steps in the code:
- Start a cas session, make caslibs visible in SAS Studio 5.1. The option metrics=true will enhance the log to display which actions are executed and other runtime metrics.
- Create a list of all the possible pairs of capital cities and their respective latitude and longitude. The dataset CitiesDist will have the columns for Origin (and its latitude and longitude) and Destination (and its latitude and Longitude) and the distance from Origin to Destination. This dataset is the input to the next step.
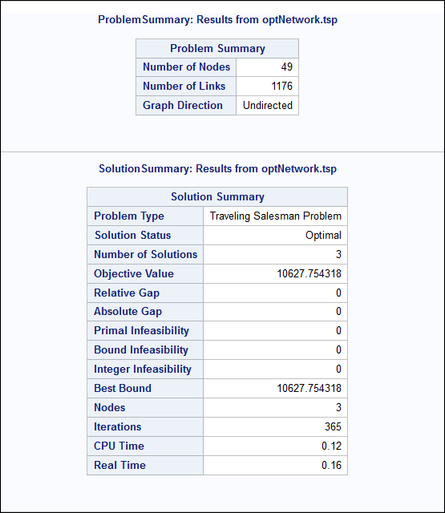
- The optNetwork Action set will be loaded and the action tsp will use the distance between city-pairs to find the shortest hamiltonian tour for all capital cities. Below is the output of this procedure. It reports that there are 49 nodes (or capital cities) in the graph and 1176 links (or connections) between those cities. The Solution Summary provides information relative to the mathematical problem. Notice that the algorithm found a solution in 0.16 seconds real time and 0.12 seconds of cpu time.
- The rest of the code gets the latitude and longitude for each city in the tour and closes the tours, that is, it adds a row so that the last city in the tour pairs to the first city.
- Promote the session level table to be a global table so that we can use SAS Visual Analytics to map the results.
Visual Analytics in Viya 3.4
These are the steps to plot the tour in a topographical US map:
- From the “New data items” create two Geography items Origin and Destination as shown for Origin
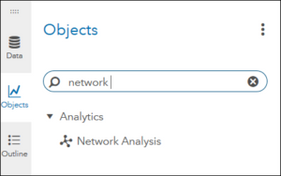
- From Objects select Network Analysis
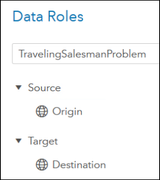
- Assign the Roles: Source = Origin, Target=Destination
- In Options, the key features are shown in the photo below
This map is the result
Conclusion
This small TSP was solved using SAS Optimization 8.3. The TSP action required a total cpu time of 0.25 seconds in CAS.
The results of the Optimization are easily displayed in a beautiful USA topographical map in Visual Analytics that shows the order each US state capital is visited in the tour.
Given the Traveling Salesman Problem described here, can you see other similar situations in your daily lives that could use this type of optimization?
References
- Computer Scientists Find New Shortcuts for Infamous Traveling Salesman Problem, Wired 2013
- SAS® 9.4 and SAS® Viya® 3.4 Programming Documentation /Network Optimization Programming Guide
Appendix
Mathematical Model (SAS/OR® 13.1 User’s Guide)
Thanks to Teri Patsilaras for her guidance on using Geographic Items and Network Analysis objects.
April 27 – 30 | Gaylord Texan | Grapevine, Texas
Registration is open
Walk in ready to learn. Walk out ready to deliver. This is the data and AI conference you can't afford to miss.
Register now and save with the early bird rate—just $795!
SAS AI and Machine Learning Courses
The rapid growth of AI technologies is driving an AI skills gap and demand for AI talent. Ready to grow your AI literacy? SAS offers free ways to get started for beginners, business leaders, and analytics professionals of all skill levels. Your future self will thank you.
- Find more articles tagged with:
- GEL
- Network Diagram
- Optimization 8.3
- Traveling salesman problem
- Viya 3.4


