- Home
- /
- SAS Communities Library
- /
- The Data-driven Content Server for SAS Visual Analytics!
- RSS Feed
- Mark as New
- Mark as Read
- Bookmark
- Subscribe
- Printer Friendly Page
- Report Inappropriate Content
The Data-driven Content Server for SAS Visual Analytics!
- Article History
- RSS Feed
- Mark as New
- Mark as Read
- Bookmark
- Subscribe
- Printer Friendly Page
- Report Inappropriate Content

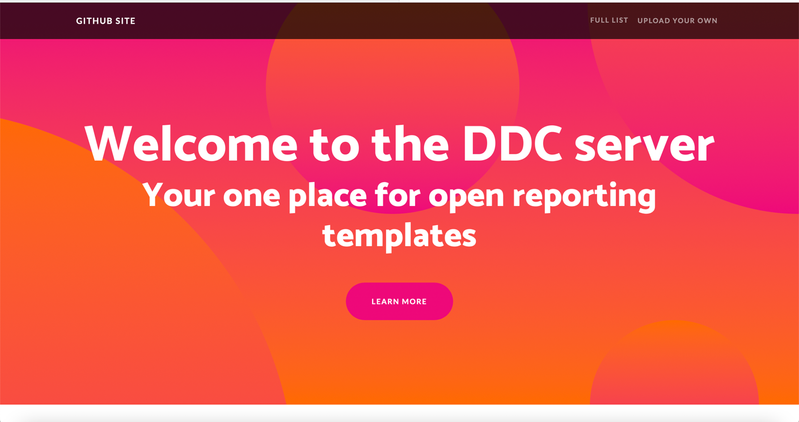
Figure 1: Homepage for the DDC Server application
Access third-party visualizations in an extremely easy manner within SAS Visual Analytics using the Data-driven Content (DDC) server!
Why do you need this?
Organisations on modern analytical platforms embrace openness and customisation. Report designers like to access not only proprietary but also open-source libraries for a variety of data visualization applications. Users of SAS Visual Analytics on Viya (VA), a self-service reporting and visualization application, love to tell data insight stories using both SAS components and open libraries, examples of which include C3.js, D3.js, and Google Charts, among others.
Since 2018, the Data-driven Content (DDC) object within VA has been helping users visualize SAS data with such open libraries and custom-built web pages. These components are usually scripted in popular platform-independent languages such as JavaScript. VA report creators, however, find some DDC configuration intimidating and cumbersome. These include the following:
- Exchanging data to and from DDC in an efficient way without having to write a lot of code,
- Harnessing and maintaining a library of preferred chart templates,
- Serving these templates efficiently from a secure web server, and
- Uploading new templates with minimal need for admin support.
The bottom line is that users demand easier and quicker access to third-party & customized reporting templates!
How do we solve this?
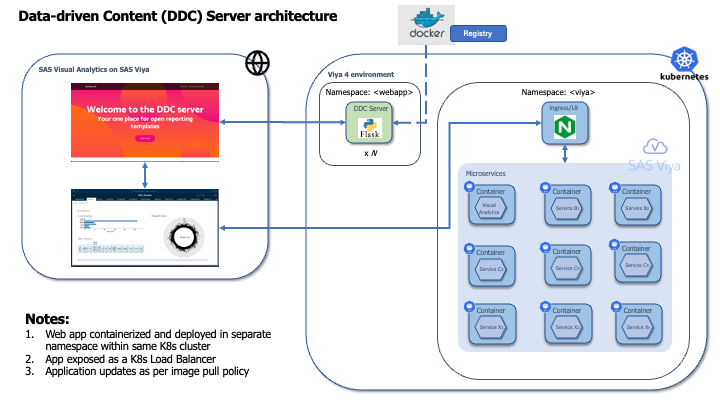
Enter the Data-driven Content (DDC) Server. The DDC Server is a simple and lightweight web application containing visualization templates to be referred as URLs within VA Data-driven Content.
Figure 2:Architecture diagram for the DDC Server
The DDC server can be deployed using cloud- and container-friendly mechanisms. Packaged within a container, the DDC server can sit alongside a SAS Viya deployment on a Kubernetes cluster and accessed through a Service exposed to users. A Kubernetes-based deployment also allows administrators to scale the server easily and rapidly as per demand, maintaining high availability and performance. For users, the only necessary information is that they obtain a URL to use within their VA reports. They need to simply point to their desired chart template within the Options tab of a DDC object and are all set to visualize their data!
Availability of all desired chart templates within a single application served over HTTPS ensures that users (i.e. report creators) need not venture into administration-related tasks such as collecting and cataloguing multiple HTML files or having to set up their own web server.
What is the user experience?
The DDC server simplifies many DDC-related configuration. Users (those whose task is to create a report, using SAS and open-source chart libraries), can access the DDC server endpoints in exactly the same way they have been using data-driven content in SAS Visual Analytics so far! Only, this is much easier!
First, users need not worry about the configuration and administration of the DDC server. Administrators now carry out this simplified task as a one-time activity. A future article will provide more details on the administration and deployment aspects of the DDC server. As a user, all you require is a URL pointing to the DDC application’s home page. Provided by the SAS Viya platform administrator, this URL does not ever change unless there is a drastic change in the status quo.
Ready-to-use Sample Visualizations!
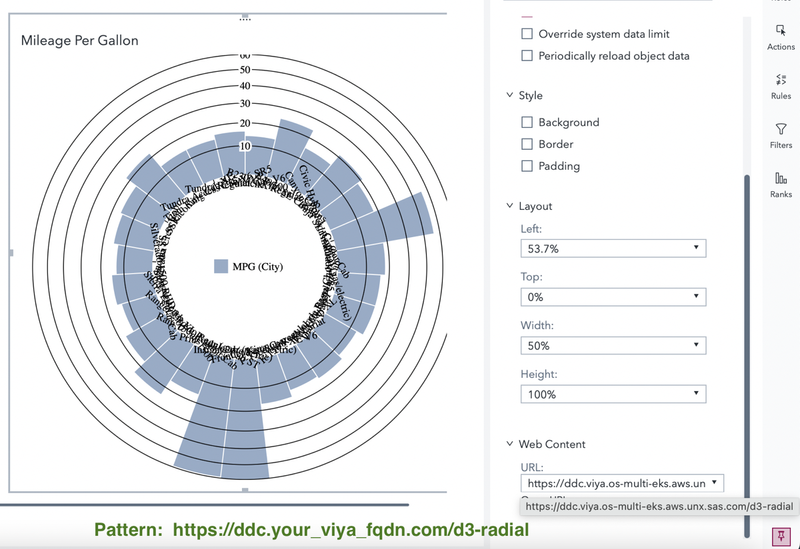
The DDC Server pre-packages a list of around 15 sample visualization templates! Select Full List from the top-right menu of the application home page in order to view a list of samples which are all taken from the SAS Github repository for third party visualizations. Simply select the chart example you would like to use and use the link obtained for the same. Or you can just refer the endpoint from the list provided in the application and enter it in the URL section of the Data-driven Content object in VA.
Figure 3: An example showing how the D3 radial chart (at endpoint /d3-radial) is accessed.
Upload your own
Want to use that shiny new custom visualization you’ve just created? Easy! The DDC Server allows you to "Upload your own" chart template from the application menu. Browse and select the HTML page (ensure your HTML page contains or has access to necessary script and style files) you would like to use, and you are all set! You will receive a new endpoint of the pattern {your base DDC Server URL}/userddc/{a filename}. Simply add this new endpoint to the URL field within the VA DDC object!
Figure 4: An example of the endpoint that results when users upload their own content.
How do I get my hands on this?
The DDC Server is now available as part of this repository on GitHub. Refer this folder within the above repository and its README for more details.
To Sum Up
The DDC Server is all set to provide you an extremely simple, easy, and enjoyable experience to develop impactful & insightful Visual Analytics reports in rapid time. It makes customized and third-party templates much more accessible.
Acknowledging this is the first ‘release’ of our DDC Server, it’s expected that users may find some aspects new and identify improvement areas. We are very eager to listen to your feedback, and urge you to drop us (Sundaresh.Sankaran@sas.com and Renato.Luppi@sas.com) an email with new requirements!
Have fun with your new DDC Server!
References:
General information : The resources for the DDC Server are currently available here : https://github.com/sassoftware/sas-visualanalytics-thirdpartyvisualizations/blob/master/ddc-server/
- Create Awesomeness: Use Custom Visualizations to Extend SAS® Visual Analytics to Get the Results You Need, SAS Global Forum proceedings 2018, Robby Powell and Renato Luppi,
https://www.sas.com/content/dam/SAS/support/en/sas-global-forum-proceedings/2018/1800-2018.pdf
- About the SAS Data-driven Content object, SAS Documentation,
https://go.documentation.sas.com/doc/en/vacdc/v_014/vaobj/n1tlhkaafz8e77n1xxc6de9iuv59.htm
- SAS GitHub repository for third party visualizations, GitHub repo,
https://github.com/sassoftware/sas-visualanalytics-thirdpartyvisualizations/tree/master/samples/
April 27 – 30 | Gaylord Texan | Grapevine, Texas
Registration is open
Walk in ready to learn. Walk out ready to deliver. This is the data and AI conference you can't afford to miss.
Register now and save with the early bird rate—just $795!
SAS AI and Machine Learning Courses
The rapid growth of AI technologies is driving an AI skills gap and demand for AI talent. Ready to grow your AI literacy? SAS offers free ways to get started for beginners, business leaders, and analytics professionals of all skill levels. Your future self will thank you.
- Find more articles tagged with:
- DataOpsWeek - Orchestration


