As someone who works with data, you know the devil’s in the details. When data is used correctly, it’s a powerful tool for building customer loyalty, preventing fraud and reducing costs—just to name a few applications. But, when data is misused or misapplied the results can be catastrophic. These mistakes matter. That’s why we want to feature your “data disaster” stories. From your many years as data experts, tell us about your experiences!
Not sure what we’re looking for?
We recently spotted this error on a major home improvement store’s website. Can you spot the data management mistake?
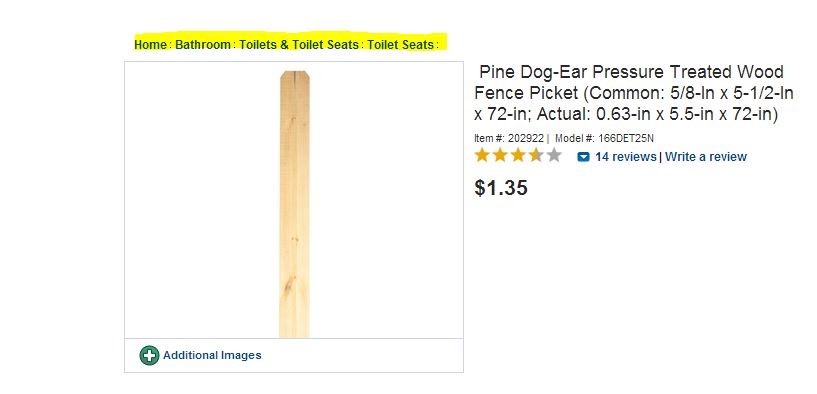
Find it? Yeah, we didn’t think this fence post should be in the bathroom section either! This is a classic case of poor data management with real impact for this retailer: the right customers won’t reach this product if it’s placed in the wrong category. Not to mention, it’ll confuse customers looking for bathroom accessories.
We also welcome your more positive stories—maybe someone else’s data error was in your favor. One of my former classmates had the same first and last name as a popular celebrity. He said that he often got free perks, extra products and VIP attention from companies thinking he was the real Mr. Big Shot. Companies made this mistake over and over again, even though the two men had different middle names and the classmate’s zip code wasn’t 90210, among other dead giveaways.
Post your experiences (by commenting below, writing another article, or posting a discussion) and we’ll highlight the data errors. Victim or instigator, active participant or observer—we want to hear your stories. No judgments, we promise!

