- Home
- /
- SAS Communities Library
- /
- Debugging SAS Visual Analytics Report Performance Problems
- RSS Feed
- Mark as New
- Mark as Read
- Bookmark
- Subscribe
- Printer Friendly Page
- Report Inappropriate Content
Debugging SAS Visual Analytics Report Performance Problems
- Article History
- RSS Feed
- Mark as New
- Mark as Read
- Bookmark
- Subscribe
- Printer Friendly Page
- Report Inappropriate Content
Debugging performance issues across distributed systems is a challenging task and it will need a step by step approach to identify the cause of the bottleneck. When it comes to performance, there are a myriad of factors involved with each one contributing in its own way to the overall problem. Sometimes, it’s like finding a needle in a haystack. Isolating the various factors is the key.
This document explains the step by step procedure used to debug report level performance issues in Visual Analytics (VA) and Visual Analytics Viewer (Viewer) application. The tests were conducted in SAS Visual Analytics 8.2 running in the SAS Viya 3.3 environment, but is also valid for the next VA release namely: SAS Visual Analytics 8.3 running in the SAS Viya 3.4 environment. We will go through an example scenario of a complex report with many interactions and multiple filters.
Before we begin – make sure the network connectivity, network latency, sizing, firewall and other items affecting performance are tuned to an optimal level and performance for these areas are acceptable. We want to make sure the issues we see in VA are not related to any of the reasons mentioned above. In this article, we will only be focusing on the report level performance issues.
Baseline # 1: simple report behavior
The very first thing to do before we start our performance assessment is to get some baseline numbers. The first baseline you would want, is to assess the performance for a simple basic report with just a list table. Create a test report with a list table using a simple data set such as cars or class from the sample data. Using the "File -> Open" dialog in VA, open the report. Note down the timings. Now use the main menu to switch into the Viewer application. Wait for any thumbnails to render, and then open the report: either by clicking on the thumbnail from the recents list, or from content navigator. In our tests here at SAS, we experienced anywhere between 4-7 seconds when using a simple stopwatch timer. The tests were done in a 4 node distributed MPP enviroment with the class data that comes as part of the sashelp library. Our servers are optimally sized and are located in a data centre with very low network latency. If you are seeing an unusually large discrepancy, then further analysis should be done as to why this simple report is taking that amount of time. The 4-7 second timing that we noted, may be different in your environment depending on these and other factors.
This is your Baseline # 1 test. Once you have an acceptable performance with your simple test report, gauge the behavior of your problematic report and document what you see. In our usecase, we saw rendering times of about 4 min in Viewer for our problematic report. Which indicated to us that there was something odd going on with our report which needed further investigation.
Enable Logs for DEBUG
While diagnosing a performance problem, we typically enable logging for Report Packages and Report Data right out of the gate. These two service logs will give a lot of valuable information. When opening a Report, the Report Viewer first generates and downloads a Report Package, with the report xml, css files, images, etc. – and then submits queries for each of the visuals on the page. In most cases, the Report Data service log is going to be the most interesting and valuable, as it includes a breakdown of the time spent on each query, and query times are typically the most time-consuming part of the process. But the Report Packages log provides a good overview and can be helpful in diagnosing delays related to image processing or other file retrievals. Significant time spent in the initial phase of the report open process (ie. before the report starts to render with individual spinners for each of the visuals) suggests a slowdown in report packaging. Note that dynamic prompts are resolved during this step, so heavy usage of dynamic prompts could increase this time.
In SAS Environment Manager, under Configuration Management, set the following properties:
Report Data Service: (set all at DEBUG)
               com.sas.bidata
               com.sas.cas
               com.sas.reportcache
               com.sas.reportcommon
               com.sas.reportcommon.utils.debug.Time
               com.sas.reportdata
Report Package Service (set all at DEBUG)
            com.sas.reportcache
            com.sas.reportcommon
            com.sas.reportcommon.utils.debug.Time
            com.sas.reportpackages
Baseline # 2
Next baseline you want to get is to compare the performance of your problematic report in VA vs Viewer, cached vs non-cached and maybe also Chrome vs Edge browser. VA and Viewer results should be comparable and should give similar results.
High level steps are as follows (Detailed steps are down below):
- Start the test fresh by clearing the report data results cache
- Open the report in VA and capture the query times.
- Open it a second time in VA and capture the query times from that run (to see if we are getting benefits from the cache).
- Open in Viewer twice and capture the query times for each
- Capture the logs
This will give us a high level picture of the overall performance, and we can evaluate the logs from here to see where to focus next.
Query Diagnostic Tool
Query Diagnostics Tool is provided within the SAS Visual Analytics application. This tool can be used to investigate issues concerning the queries that SAS Visual Analytics generates for the CAS server
           Open your report in SAS Visual Analytics.
           Select any object in your report.
           Press Ctrl+Alt+Q on your keyboard
You will notice the Query Diagnostic Window pop up.

For more details on how to use the Query Diagnostic tool: refer to the following SAS note
Clear report data results cache
In the Query Diagnostic tool window click on the trash can on the top right corner (number 4 in the picture above). Clicking on this icon clears the VA and Viewer report data results cache.
Note: You need to be logged in as an Administrator when attempting to clear cache. It will not work if you are not an administrator, and there is no indication in the tool telling you that it did not work.
Conduct the Baseline # 2 test
- Restart report-data service to get clean logs
- On a linux xterm: tail -f the report-data logs. This is imp.
- Log into VA
- If asked, say Yes to being an administrator
- In VA – Instead of opening a report, Create a New report.
- Clear report data results cache: Ctrl+Alt+ Q and then click on the Trash can
- In the report-data log – you should immediately see a message such as this:
       2018-06-04 16:11:44.008  INFO 88684 --- [o-auto-1-exec-5]
       c.s.r.service.ReportDataService: mevenk(23fb06cf) [0e0f5fe807bc2aa4]
Results Cache is cleared - Close the Query Diagnostics window.
- Open the report in VA. Note: Report will open without cache.
- As the report is rendering, you will notice a lot of messages in the report-data log
- Note down the clock time when the rendering is complete
- In the report-data log you should see a query such as this when that report fully renders. This is the indication of the time the last VA query took to complete. VA does not give us a good record of the first and last query in the logs and hence having this information helps us to isolate the first run from the second run of opening the report in VA.
Total elapsed time (ms) for GetData - QUERY - query:b63da329-150c-43dd-99b7-36a279c8a90a_c45 - [dd124922] = 206621
- Reopen the report in VA using the File menu option. This time report will open with cache.
- Start the Viewer test. From the main menu, go to View reports, open the report. Notice report will open without cache.
- Close the report
- Re-open the report again – Notice that this time report will open with cache.
- Stop the test
- Collect the report-data log and move it to your personal machine where you have Text Pad.
Since report-data service was restarted before the test, we should have clean logs for the following tests and in the following order. It also helps to do the tests while no one else is on the system. This may not be possible in many cases but if we can keep the logs as clean as possible - we will be better able to understand where the root of the problem lies.
VA without cache  (Total Time: 3.55 min)
VA with cache    (Total Time: 30 sec)
Viewer without cache   (Total Time: 3.58 min)
Viewer with cache     (Total Time: 38 sec)
Analysis of sas-report-data Logs
Both VA queries and Viewer queries go through report-data service and publish information there. If you open a report in VA, we would expect to see log messages referencing 'GetData - QUERY' - and if you open a report in Viewer, we would expect to see log messages referencing 'GetData - PACKAGE' or 'GetData - REPORT' or more specifically - one 'GetData - PACKAGE' and lots of 'GetData - REPORT'
- In TextPad open your report-data log
- Do a search on “total elapsed time” and “Mark All” instances of the search
- Close the search window,
- Edit -> Copy Other -> Bookmarked lines
- Paste it in a new Textpad document and call it "queries.txt". This will give you a summary of the time it took to run the individual queries in VA and Viewer.
As an example: the following sequence represents the typical requests you will see coming through when opening a report in VA:
Total elapsed time (ms) for GetData - QUERY - query:e783e390-67be-4bcc-bc69-42bfc001a9a4_c39 - [dd106441] = 534
Total elapsed time (ms) for GetData - QUERY - query:fb4bfc2e-4b9c-4976-a304-30a60e1d07ac_c42 - [dd128265] = 595
Total elapsed time (ms) for GetData - QUERY - query:695004cf-0b99-4065-9a6f-a6751eff97bf_c37 - [dd124922] = 2497
As an example: the following sequence represents the typical requests you will see coming through when opening a report in Viewer: Create Metadata Supplement, Get Package Data, and then a series of Get Report Data calls.
2018-05-30 21:59:36.205 --- Total elapsed time (ms) for CreateMetadataSupplement - custom = 2940
2018-05-30 21:59:38.284 --- Total elapsed time (ms) for GetData - PACKAGE - pkg:i_08232f9b-406e-4306-b4e0-5cc8a1ab5e53/nodata - [dd23, dd81] = 2024
2018-05-30 21:59:54.791 --- Total elapsed time (ms) for GetData - REPORT - uri:/reports/reports/510c5a9b-f842-41a3-be64-0e53619b250e - [dd81] = 836
2018-05-30 21:59:54.824 --- Total elapsed time (ms) for GetData - REPORT - uri:/reports/reports/510c5a9b-f842-41a3-be64-0e53619b250e - [dd23] = 869
2018-05-30 22:00:04.084 --- Total elapsed time (ms) for GetData - REPORT - uri:/reports/reports/510c5a9b-f842-41a3-be64-0e53619b250e - [dd81] = 1759
2018-05-30 22:00:04.137 --- Total elapsed time (ms) for GetData - REPORT - uri:/reports/reports/510c5a9b-f842-41a3-be64-0e53619b250e - [dd23] = 1632
2018-05-30 22:00:04.392 --- Total elapsed time (ms) for GetData - REPORT - uri:/reports/reports/510c5a9b-f842-41a3-be64-0e53619b250e - [dd81] = 1500
If any of the thumbnails required rendering when you opened a report in Viewer, you will see log messages from these calls as well. These would appear as pairs of CreateMetadataSupplement / GetData - PACKAGE, where the package data call is a ‘baseline’ package with a single dd reference. Something like this …
2018-05-30 21:59:36.205 --- Total elapsed time (ms) for CreateMetadataSupplement - custom = 1221
2018-05-30 21:59:38.284 --- Total elapsed time (ms) for GetData - PACKAGE - pkg:b_08232f9b-406e-4306-b4e0-5cc8a1ab5e53/baseline - [dd12] = 1234
'interactive' packages are generated by SAS Visual Analytics App (mobile) and include processing of all queries.
'nodata' packages are generated for the web viewer.
The first example below is indicative of a mobile request. The second is what we would expect to see from the Web Viewer.
2018-05-30 21:59:38.284 --- Total elapsed time (ms) for GetData - PACKAGE - pkg:i_08232f9b-406e-4306-b4e0-5cc8a1ab5e53/interactive - [dd23, dd81] = 2024

      … vs …

2018-05-30 21:59:38.284 --- Total elapsed time (ms) for GetData - PACKAGE - pkg:n_08232f9b-406e-4306-b4e0-5cc8a1ab5e53/nodata - [dd23, dd81] = 2024
Analysis of VA queries in detail
Now let us look at the queries.txt file you created above. Identify and separate VA queries without cache and with cache. As I mentioned before, VA does not give us a good record of the first and last query from a report run, hence having the information about how long that last query took to run, helps us separate the VA queries from our tests.
Do the same with the Viewer queries. They are easy to separate as each Viewer report open starts with a clear GET DATA - PACKAGE. Add some comments for documentation. See below the example log of my last nine VA queries for my non cached tests below.
Non-cached VA queries
  Total elapsed time (ms) for GetData - QUERY - query:e783e390-67be-4bcc-bc69-42bfc001a9a4_c39 - [dd106441] = 534
  Total elapsed time (ms) for GetData - QUERY - query:fb4bfc2e-4b9c-4976-a304-30a60e1d07ac_c42 - [dd128265] = 595
  Total elapsed time (ms) for GetData - QUERY - query:695004cf-0b99-4065-9a6f-a6751eff97bf_c37 - [dd124922] = 2497
  Total elapsed time (ms) for GetData - QUERY - query:fb4bfc2e-4b9c-4976-a304-30a60e1d07ac_c43 - [dd128229] = 2507
  Total elapsed time (ms) for GetData - QUERY - query:695004cf-0b99-4065-9a6f-a6751eff97bf_c36 - [dd106578] = 4001
  Total elapsed time (ms) for GetData - QUERY - query:695004cf-0b99-4065-9a6f-a6751eff97bf_c38 - [dd121960] = 4678
  Total elapsed time (ms) for GetData - QUERY - query:695004cf-0b99-4065-9a6f-a6751eff97bf_c44 - [dd106578] = 73837
  Total elapsed time (ms) for GetData - QUERY - query:695004cf-0b99-4065-9a6f-a6751eff97bf_c46 - [dd121960] = 73826
  Total elapsed time (ms) for GetData - QUERY - query:695004cf-0b99-4065-9a6f-a6751eff97bf_c45 - [dd124922] = 209421
Cached VA Queries
  Total elapsed time (ms) for GetData - QUERY - query:6ff3c57f-20d1-413e-a943-219e14c2b1f8_c91 - [dd106441] = 96
  Total elapsed time (ms) for GetData - QUERY - query:e69d9a2c-869a-45d1-b2f8-c4b995e63552_c86 - [dd128265] = 1351
  Total elapsed time (ms) for GetData - QUERY - query:a66c3df3-279e-4031-86fb-736e104d5ad8_c89 - [dd124922] = 1194
  Total elapsed time (ms) for GetData - QUERY - query:e69d9a2c-869a-45d1-b2f8-c4b995e63552_c88 - [dd128229] = 1636
  Total elapsed time (ms) for GetData - QUERY - query:a66c3df3-279e-4031-86fb-736e104d5ad8_c87 - [dd106578] = 105
  Total elapsed time (ms) for GetData - QUERY - query:a66c3df3-279e-4031-86fb-736e104d5ad8_c90 - [dd121960] = 1163
  Total elapsed time (ms) for GetData - QUERY - query:a66c3df3-279e-4031-86fb-736e104d5ad8_c94 - [dd106578] = 404
  Total elapsed time (ms) for GetData - QUERY - query:a66c3df3-279e-4031-86fb-736e104d5ad8_c96 - [dd121960] = 422
  Total elapsed time (ms) for GetData - QUERY - query:a66c3df3-279e-4031-86fb-736e104d5ad8_c95 - [dd124922] = 464
Notice that the caching has really brought down the query times. We are definitely seeing benefits of caching. The very last entry for query: dd124922 is taking 209421 ms without caching, but is taking 464 ms with caching.
This query (dd124922) has taken 209421 ms (209 sec or 3.49 min) to run without cache. That is a long run time for a query and could be the reason why our VA report took 3:55 min to open without cache. Now, Let us drill deeper into the query itself.
Drilling into the hard hitting VA query
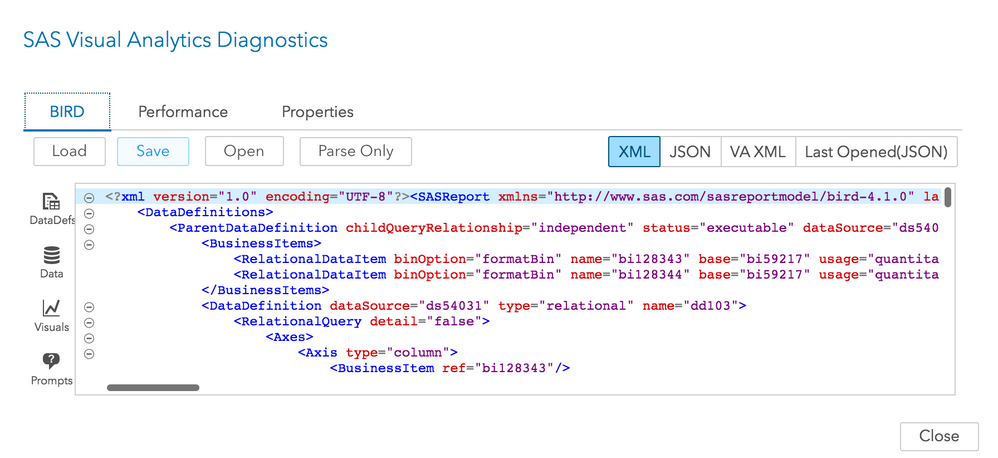
We will need to get the BIRD xml from VA. Doing a ctrl+alt+B on the VA report will open a window as below:
Save the BIRD. If you study the BIRD, you will notice that each query is structured as a ParentDataDefinition block. A search on
the query of interest: dd124922 will find us a block such as this:
<ParentDataDefinition childQueryRelationship="independent" status="executable" dataSource="ds54909" name="dd124922">
If you scroll a bit in the xml - you will notice one or more child definitions under the parent, in the form of a DataDefinition such as this:
<DataDefinition dataSource="ds54909" type="multidimensional" name="dd124923">
dd124922 is the parent query and dd124923 is the child query. VA runs the parent query. Viewer keys off of the ‘childQueryRelationship’ – if ‘independent’, it runs each of the child queries independently; otherwise, it runs the parent.
A further search of the query dd124922 in the BIRD will tell us the visual name and label associated with the query.
  <Graph graphType="bar" supplementalVisuals="ve124924" resultDefinitions="dd124912"
   name="ve124937"  data="dd124922" label="Andamento Puntualità" action="ac195691"
   applyDynamicBrushes="yes" sourceInteractionVariables="bi124911 bi130428">
In this case the visual label is "Andamento Puntualità" and the name is "ve124937"
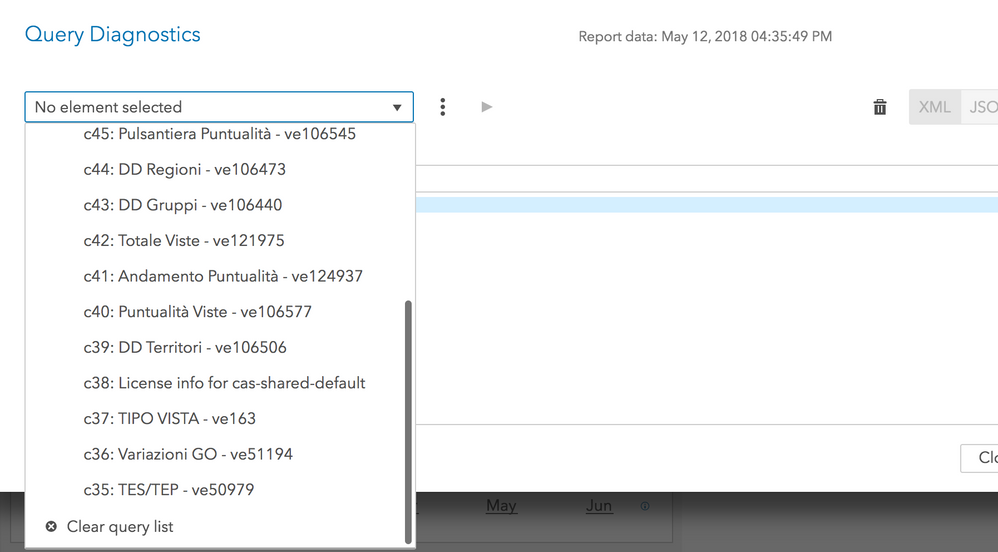
Now let us go to the Query Diagnostic Tool in VA. Notice you will find a drop down with all the query info. Select the one associated with the above query which in this case is: c41: Andamento Puntualita - ve124937
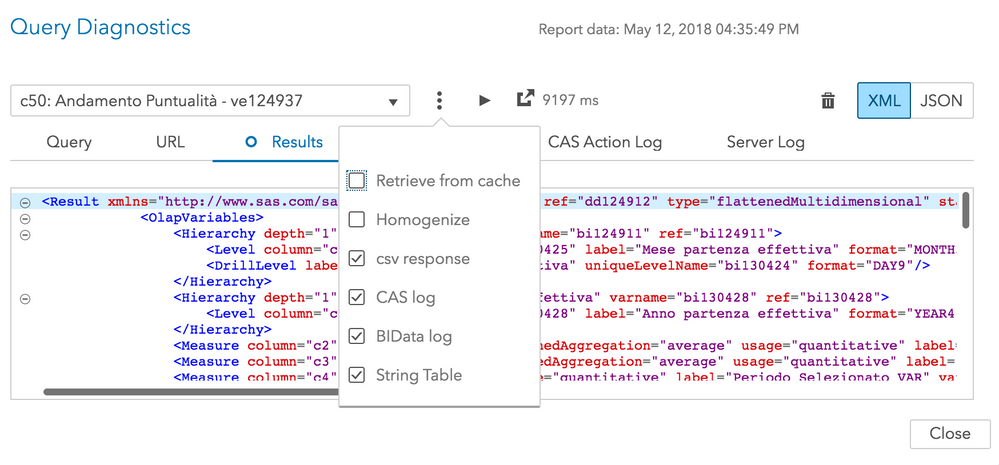
You could actually run this query by clicking on the play button next to it. You can specify in the scrollbar below if you want to run it from cache or otherwise.
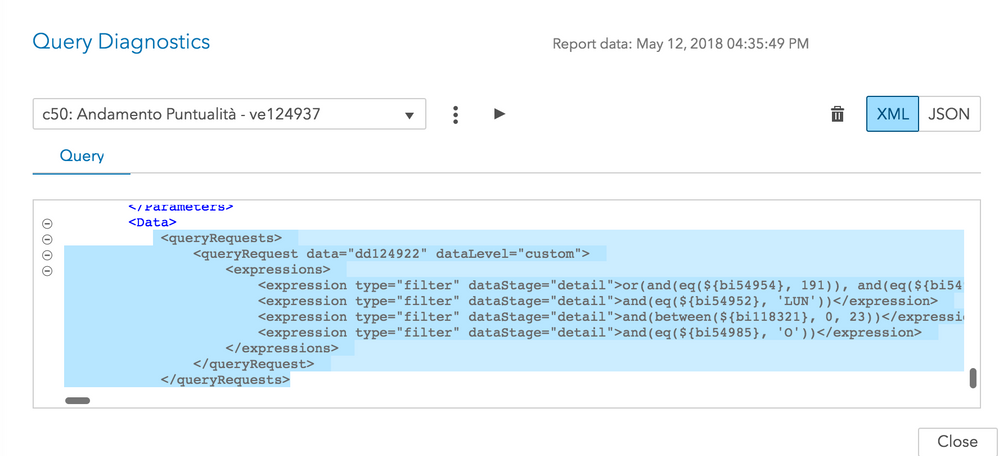
This is our hard hitting query and a careful study indicated to us that the query is associated with a big where clause which is where the maximum amount of time is spent during report open. Based on this piece of information, we reworked our backend data to optimize the combinations and the number of observations that was being passed to the report filter. This brought down the query time considerably both in VA and Viewer.
           <queryRequests>
               <queryRequest data="dd124922" dataLevel="custom">
                   <expressions>
                       <expression type="filter" dataStage="detail">or(and(eq(${bi54954}, 191)), and(eq(${bi54954}, 192)), and(eq(${bi54954}, 193)), and(eq(${bi54954}, 194)), and(eq(${bi54954}, 202)), and(eq(${bi54954}, 203)), and(eq(${bi54954}, 204)), and(eq(${bi54954}, 206)), and(eq(${bi54954}, 212)), and(eq(${bi54954}, 213)), and(eq(${bi54954}, 214)), and(eq(${bi54954}, 215)), and(eq(${bi54954}, 216)), and(eq(${bi54954}, 217)), and(eq(${bi54954}, 218)), and(eq(${bi54954}, 219)), and(eq(${bi54954}, 220)), and(eq(${bi54954}, 223)), and(eq(${bi54954}, 224)), and(eq(${bi54954}, 225)), and(eq(${bi54954}, 228)), and(eq(${bi54954}, 229)), and(eq(${bi54954}, 230)), and(eq(${bi54954}, 231)), and(eq(${bi54954}, 232)), and(eq(${bi54954}, 235)), and(eq(${bi54954}, 239)), and(eq(${bi54954}, 240)), and(eq(${bi54954}, 241)), and(eq(${bi54954}, 242)), and(eq(${bi54954}, 243)), and(eq(${bi54954}, 250)), and(eq(${bi54954}, 253)), and(eq(${bi54954}, 257)), and(eq(${bi54954}, 259)), and(eq(${bi54954}, 260)), and(eq(${bi54954}, 264)), and(eq(${bi54954}, 267)), and(eq(${bi54954}, 268)), and(eq(${bi54954}, 273)), and(eq(${bi54954}, 274)), and(eq(${bi54954}, 276)), and(eq(${bi54954}, 277)), and(eq(${bi54954}, 278)), and(eq(${bi54954}, 279)), and(eq(${bi54954}, 280)), and(eq(${bi54954}, 281)), and(eq(${bi54954}, 282)), and(eq(${bi54954}, 283)), and(eq(${bi54954}, 284)), and(eq(${bi54954}, 285)), and(eq(${bi54954}, 286)), and(eq(${bi54954}, 287)), and(eq(${bi54954}, 289)), and(eq(${bi54954}, 290)), and(eq(${bi54954}, 291)), and(eq(${bi54954}, 294)), and(eq(${bi54954}, 296)), and(eq(${bi54954}, 297)), and(eq(${bi54954}, 298)), and(eq(${bi54954}, 299)), and(eq(${bi54954}, 301)), and(eq(${bi54954}, 302)), and(eq(${bi54954}, 303)), and(eq(${bi54954}, 304)), and(eq(${bi54954}, 306)), and(eq(${bi54954}, 307)), and(eq(${bi54954}, 308)), and(eq(${bi54954}, 309)), and(eq(${bi54954}, 310)), and(eq(${bi54954}, 311)), and(eq(${bi54954}, 312)), and(eq(${bi54954}, 313)), and(eq(${bi54954}, 314)), and(eq(${bi54954}, 315)), and(eq(${bi54954}, 316)), and(eq(${bi54954}, 318)), and(eq(${bi54954}, 319)), and(eq(${bi54954}, 320)), and(eq(${bi54954}, 321)), and(eq(${bi54954}, 322)), and(eq(${bi54954}, 323)), and(eq(${bi54954}, 324)), and(eq(${bi54954}, 325)), and(eq(${bi54954}, 326)), and(eq(${bi54954}, 327)), and(eq(${bi54954}, 328)), and(eq(${bi54954}, 330)), and(eq(${bi54954}, 331)), and(eq(${bi54954}, 332)), and(eq(${bi54954}, 333)), and(eq(${bi54954}, 334)), and(eq(${bi54954}, 336)), and(eq(${bi54954}, 337)), and(eq(${bi54954}, 338)), and(eq(${bi54954}, 339)), and(eq(${bi54954}, 340)), and(eq(${bi54954}, 341)), and(eq(${bi54954}, 342)), and(eq(${bi54954}, 343)), and(eq(${bi54954}, 344)), and(eq(${bi54954}, 345)), and(eq(${bi54954}, 346)), and(eq(${bi54954}, 347)), and(eq(${bi54954}, 348)), and(eq(${bi54954}, 349)), and(eq(${bi54954}, 352)), and(eq(${bi54954}, 353)), and(eq(${bi54954}, 355)), and(eq(${bi54954}, 356)), and(eq(${bi54954}, 357)), and(eq(${bi54954}, 358)), and(eq(${bi54954}, 361)), and(eq(${bi54954}, 362)), and(eq(${bi54954}, 363)), and(eq(${bi54954}, 364)), and(eq(${bi54954}, 365)), and(eq(${bi54954}, 366)), and(eq(${bi54954}, 368)), and(eq(${bi54954}, 369)), and(eq(${bi54954}, 370)))</expression>
                       <expression type="filter" dataStage="detail">and(eq(${bi54952}, 'LUN'))</expression>
                       <expression type="filter" dataStage="detail">and(between(${bi118321}, 0, 23))</expression>
                       <expression type="filter" dataStage="detail">and(eq(${bi54985}, 'O'))</expression>
                   </expressions>
               </queryRequest>
Analysis of Viewer Queries
As is the case with VA, Viewer does not have a diagnostic tool to anlayze the queries in detail. However, we can use the following general guidelines while diagnosing Viewer queries:
- Viewer query times should be similar to VA query timings. They should roughly be taking the same amount of time.
- The total number of VA queries for each page of a report should be similar to Viewer query numbers. For example: if VA total queries were 35 and Viewer was at 77: then this is an indication that something is not right and we need to do more investigation. We can get this information from the queries.txt file we created in the earlier step.
- In Viewer, we should only be running the queries required for the first section when the report renders. Then, when switching sections, we will run the queries needed for the new section. If you are seeing queries being run for other sections, then that needs further investigation.
Conclusion
Diagnosing performance-related issues is a complex process, requiring attention to detail. Applying this information will help you quickly diagnose issues when they arise.
- Mark as Read
- Mark as New
- Bookmark
- Permalink
- Report Inappropriate Content
Thanks for the note. This will be very helpful to SAS VA admins! There seems to be some dialogs/images missing though.
For example there is no window/image under the text "A window similar to the following should appear (notations added):". Also there is the text Meera Query1.png Meera Query2.png Meera Query3.png where I think images are suppose to be.
Thanks,
Michelle
- Mark as Read
- Mark as New
- Bookmark
- Permalink
- Report Inappropriate Content
- Mark as Read
- Mark as New
- Bookmark
- Permalink
- Report Inappropriate Content
Thanks @Meera_SAS! Good to see them now - helps to better understand the surrounding text.
There seems to be another dialog missing under the text "A window similar to the following should appear (notations added):"
- Mark as Read
- Mark as New
- Bookmark
- Permalink
- Report Inappropriate Content
- Mark as Read
- Mark as New
- Bookmark
- Permalink
- Report Inappropriate Content
Ahhhh makes sense now. Thank you.
- Mark as Read
- Mark as New
- Bookmark
- Permalink
- Report Inappropriate Content
Excellent article.
really useful.
But i didn't quite understand how the query cache works?
is it possible to activate it before a user opens the report?
Can we automatically cache the longest requests?
Thank you in advance for your answers
Catch up on SAS Innovate 2026
Dive into keynotes, announcements and breakthroughs on demand.
Explore Now →SAS AI and Machine Learning Courses
The rapid growth of AI technologies is driving an AI skills gap and demand for AI talent. Ready to grow your AI literacy? SAS offers free ways to get started for beginners, business leaders, and analytics professionals of all skill levels. Your future self will thank you.


