- Home
- /
- SAS Communities Library
- /
- Custom Task Tuesday: Clinical Grouped Bar Chart
- RSS Feed
- Mark as New
- Mark as Read
- Bookmark
- Subscribe
- Printer Friendly Page
- Report Inappropriate Content
Custom Task Tuesday: Clinical Grouped Bar Chart
- Article History
- RSS Feed
- Mark as New
- Mark as Read
- Bookmark
- Subscribe
- Printer Friendly Page
- Report Inappropriate Content

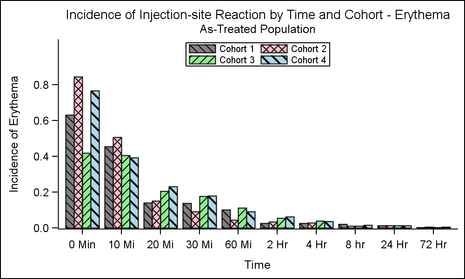
This week on Custom Task Tuesday we will look at a task for creating and customizing this clinical grouped bar chart (from this post of @Jay54's on the Graphically Speaking blog):
Check out what the task looks like below:
This task offers the user a few simple graph customization options. For simplicity, all options appear on one tab called "GRAPH."
Parameterizing SGPLOT Code
I want to highlight which parts of the SGPLOT code are being replaced by task controls and which are not. In the photo below, the boxed portions of the code are going to be filled in by a task control, while the rest are hard coded:
You can see that there are plenty of additional parameters that could've been built into the task such as group display, x-axis order, font size, etc.
After we replace the code in those boxes with the velocity macro variables from our task controls, here's what the Code Template portion for this task looks like:
#if ($comboTHEME == 'inspire')
%let fillcolors= cx21b9b7 cx4141e0 cx7db71a cx8e2f8a cxd38506 cx0abf85 cx2f90ec;
#end
#if ($comboTHEME == 'illuminate')
%let fillcolors= cx00929f cxf08000 cx90b328 cx3d5aae cxffca39 cxa6427c cx9c2910 cx736519;
#end
#if ($comboTHEME == 'grayscale')
%let fillcolors= cx585858 cxa2a2a2 cx1e1e1e cx707070 cxbbbbbb cx3b3b3b cxd0d0d0;
#end
#if ($comboTHEME == 'pastel')
%let fillcolors= cxb3e2cd cxfdcdac cxcbd5e8 cxf4cae4 cxe6f5c9 cxfff2ae cxf1e2cc cxcccccc;
#end
#if ($comboTHEME == 'bright')
%let fillcolors= cx3190D0 cxFF991A cx3EBB3B cxF23E39 cxAF7ED9 cxA77063 cxFF8EDD cxD6D91A;
#end
#if ($comboTHEME == 'dark')
%let fillcolors= cx1b9e77 cxd95f02 cx7570b3 cxe7298a cx66a61e cxe6ab02 cxa6761d cx666666;
#end

title '$textTITLE1';
title2 '$textTITLE2';
proc sgplot data=$DATASOURCE nowall noborder;
  #if ($comboTHEME != 'default')
  styleattrs datacolors=(&fillcolors) datacontrastcolors=(black);
  #end
  vbar #foreach ($item in $TIMEVAR) $item #end / #foreach ($item in $RESPVAR) response=$item #end #foreach ($item in $GROUPVAR) group=$item #end groupdisplay=cluster baselineattrs=(thickness=0);
  xaxis discreteorder=data;
  yaxis offsetmax=0.2;
  keylegend / title='' location=$comboLEGENDLOC position=$comboLEGENDPOS border autoitemsize valueattrs=(size=8) #if($radioORIENTATION == 'radioHorizontal') down=1 #end #if($radioORIENTATION == 'radioVertical') across=1 #end;
run;
title;
As always, the full code for this task is available for download on the Task Tuesday GitHub! Download the task and use it as-is or edit it to make it your own.
Check out the Task Tuesday GitHub
Download the injection site reaction task on the Task Tuesday GitHub!
Take Me to GitHub!
Join the Conversation on Twitter
Use the hashtag #CustomTaskTuesday and tweet @OliviaJWright with your Custom Task comments and questions!
SAS AI and Machine Learning Courses
The rapid growth of AI technologies is driving an AI skills gap and demand for AI talent. Ready to grow your AI literacy? SAS offers free ways to get started for beginners, business leaders, and analytics professionals of all skill levels. Your future self will thank you.
- Find more articles tagged with:
- Custom Task Tuesday


