- Home
- /
- Programming
- /
- Programming
- /
- Re: Use variable label instead of variable name in a graph`
- RSS Feed
- Mark Topic as New
- Mark Topic as Read
- Float this Topic for Current User
- Bookmark
- Subscribe
- Mute
- Printer Friendly Page

- Mark as New
- Bookmark
- Subscribe
- Mute
- RSS Feed
- Permalink
- Report Inappropriate Content
I am using- ods graphics to obtain my graphs, what I can figure out is how to use the variable label instead of the variable name (which is usually kind of cryptic!)!

- Mark as New
- Bookmark
- Subscribe
- Mute
- RSS Feed
- Permalink
- Report Inappropriate Content
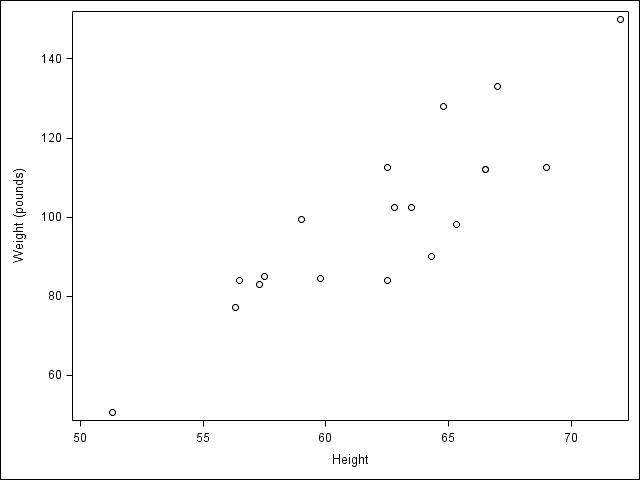
ODS graphics does use variable labels on axes labels:
data class;
set sashelp.class;
label weight="Weight (pounds)";
run;
proc sgplot;
scatter x=height y=weight;
run;
PG
- Mark as New
- Bookmark
- Subscribe
- Mute
- RSS Feed
- Permalink
- Report Inappropriate Content
here is what happens
ods graphics on;
proc logistic data=stage3concurrent plots(only)=oddsratio (type=horizontalstat range=(0,3)) ;
CLASS urban regionvisn yeargroup (ref='2001-2004') EPvsTC stage numsquam;
model EPvsTC (event='Cisplatin and Etoposide')= yeargroup stage numsquam priorhosp age10 poslostweightperc fullhgb fullalb chrlson egfr2 / risklimits lackfit rsquare parmlabel;
units egfr2=10 priorhosp=1 age10=1 poslostweightperc=1 fullhgb=1 fullalb=1 chrlson=1;
run;
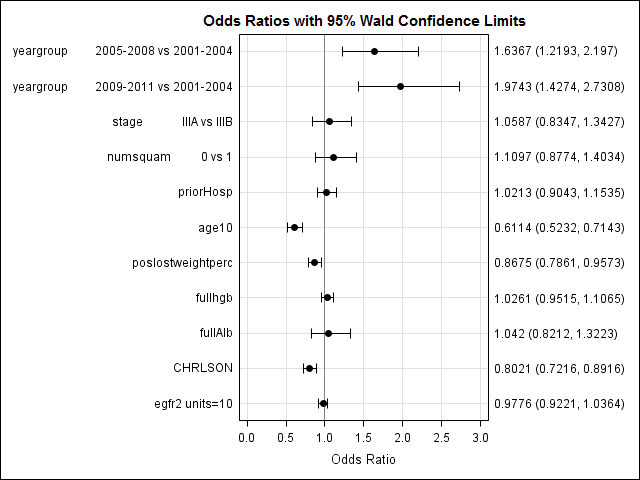
how can a change the labels on the graph to the variable label?

- Mark as New
- Bookmark
- Subscribe
- Mute
- RSS Feed
- Permalink
- Report Inappropriate Content
You'll probably have to modify the template ![]()
SAS Innovate 2025: Call for Content
Are you ready for the spotlight? We're accepting content ideas for SAS Innovate 2025 to be held May 6-9 in Orlando, FL. The call is open until September 25. Read more here about why you should contribute and what is in it for you!
Learn how use the CAT functions in SAS to join values from multiple variables into a single value.

Find more tutorials on the SAS Users YouTube channel.
 Click image to register for webinar
Classroom Training Available!
Select SAS Training centers are offering in-person courses. View upcoming courses for:
-
3 replies
-
02-28-2014 12:59 PM
-
3173 views
-
0 likes
-
3 in conversation
-
