- Home
- /
- Programming
- /
- Programming
- /
- Proc gchart options
- RSS Feed
- Mark Topic as New
- Mark Topic as Read
- Float this Topic for Current User
- Bookmark
- Subscribe
- Mute
- Printer Friendly Page

- Mark as New
- Bookmark
- Subscribe
- Mute
- RSS Feed
- Permalink
- Report Inappropriate Content
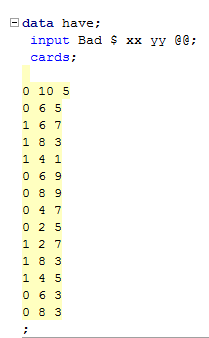
In the following data set I have three variables bad xx and yy.
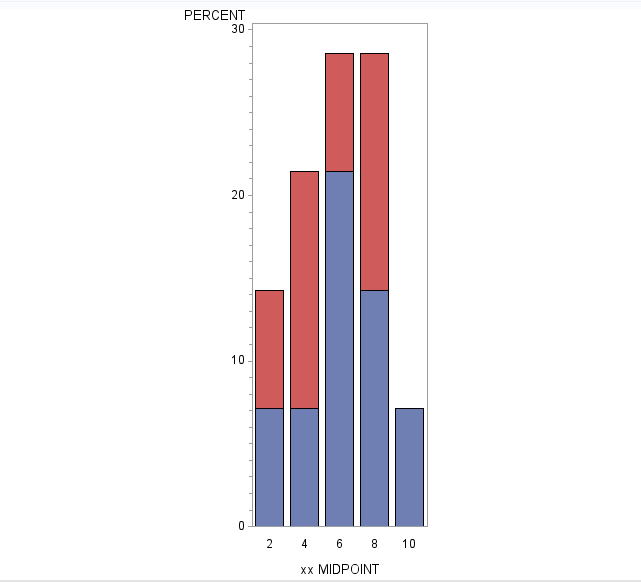
I want to make histograms of XX and YY such that at each level of a variable say XX, I want to divide the column by proportion or percentage of bad=1 and bad=0.
My following attempts does this job but it divides each column by percentage of bad=0 and bad=1 w.r.t to all the values of XX.
For variable XX, I want bars of the histogram at 2,4,6,8 and 10, however division of each bar should be done based on the number of bad=1/bad=0 within that level of XX.
If this can be done, all the vertical bars will have equal height, but get divided by percentage/proportion of bad values within that level of XX.
Using the following code
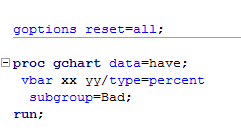
I have this plot
As always, I am expecting some help from one of you experts.
Thanks again for your time!

- Mark as New
- Bookmark
- Subscribe
- Mute
- RSS Feed
- Permalink
- Report Inappropriate Content
You may be looking for G100 which requires use of Group not subgroup. Since you posted pictures of code and note code I'm too lazy to retype the data example so I can't test.
- Mark as New
- Bookmark
- Subscribe
- Mute
- RSS Feed
- Permalink
- Report Inappropriate Content
here is the code
Thanks
data have;
input Bad $ xx yy @@;
cards;
0 10 5
0 6 5
1 6 7
1 8 3
1 4 1
0 6 9
0 8 9
0 4 7
0 2 5
1 2 7
1 8 3
1 4 5
0 6 3
0 8 3
;
goptions reset=all;
proc gchart data=have;
vbar xx yy/type=percent
group=Bad;
run;
quit;

- Mark as New
- Bookmark
- Subscribe
- Mute
- RSS Feed
- Permalink
- Report Inappropriate Content
What version of SAS do you have? Can you use the SG graphical procedures, ie SGPLOT?

Available on demand!
Missed SAS Innovate Las Vegas? Watch all the action for free! View the keynotes, general sessions and 22 breakouts on demand.
Learn how use the CAT functions in SAS to join values from multiple variables into a single value.

Find more tutorials on the SAS Users YouTube channel.
 Click image to register for webinar
Classroom Training Available!
Select SAS Training centers are offering in-person courses. View upcoming courses for:
-
3 replies
-
03-07-2013 08:11 PM
-
561 views
-
0 likes
-
3 in conversation
-
