Have you ever wanted to use a model that you have built in SAS Visual Analytics to score on new unseen data? Well, that is quite simple! Just follow the steps below:
Note: The score code for "SAS Visual Statistics" models will look a little different compared to "SAS Visual Data Mining and Machine Learning" models due to its complexity. I will start by showing you how to do this for a "SAS Visual Statistics" model, before I move over to a "SAS Visual Data Mining and Machine Learning" model.
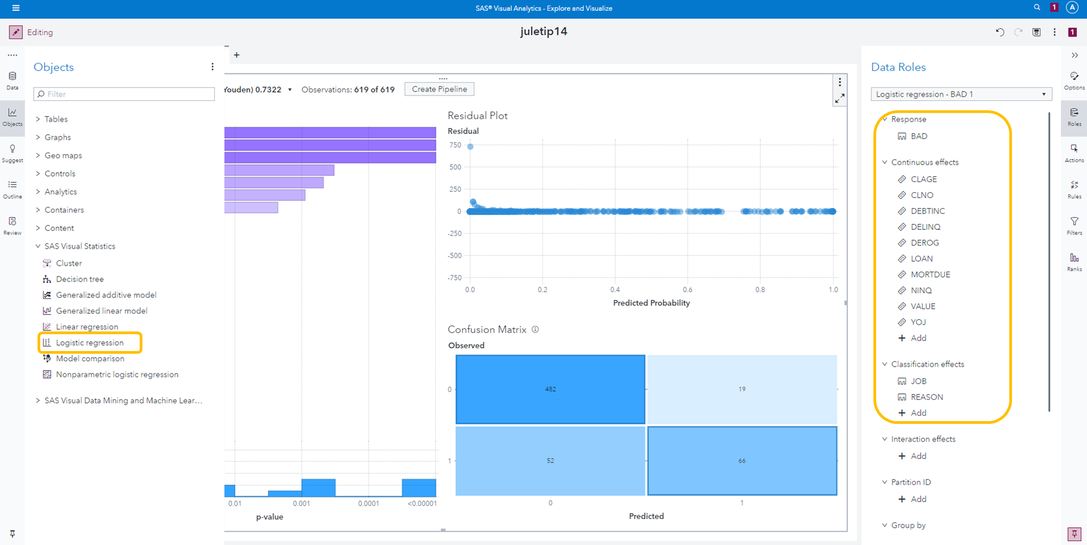
1. Lets start by building a simple logistic regression in SAS Visual Analytics.
The dataset I'm using is for classifying loan default and it is already divided into four datasets. One for each quarter. I will use the dataset for Q1 to train my model, and I will score on Q2 and Q3.
I'll drag and drop the logistic regression object and assign my variables to it. Once it have the necessary variables it will automatically be trained.
My target variable "BAD" is 1 if the observation had a loan default and 0 if not.
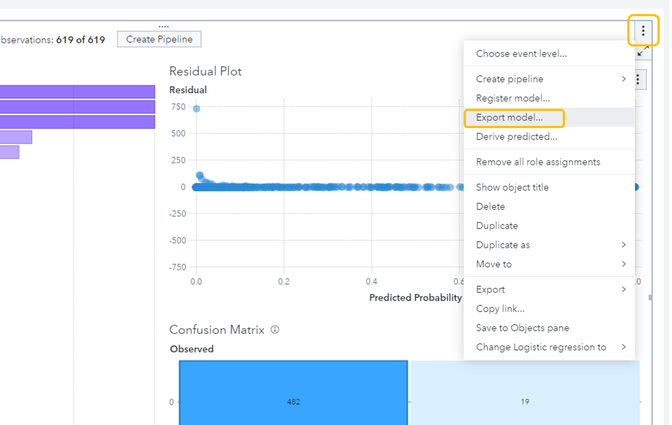
2. Lets say that I'm happy with the model and want to export the model.
I will click on the three dots in the top right corner of the object and select "Export model...".
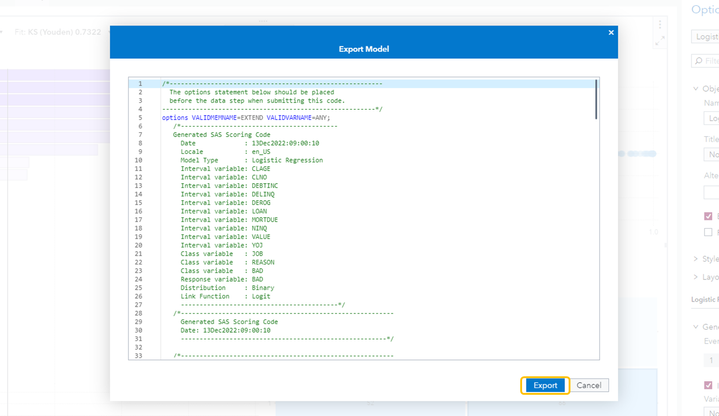
You will then be presented with the score code to your model. You can choose to either copy the score code and paste it into a program in SAS Studio, or you can download it as a .sas file.
I will show you the latter one. Simply select "Export" as shown below and the score code will be downloaded.
I now have the .sas file in my download folder in the file explorer:

3. Next step is to upload this into SAS Studio. Navigate to the folder where you want to upload it and select the upload button.
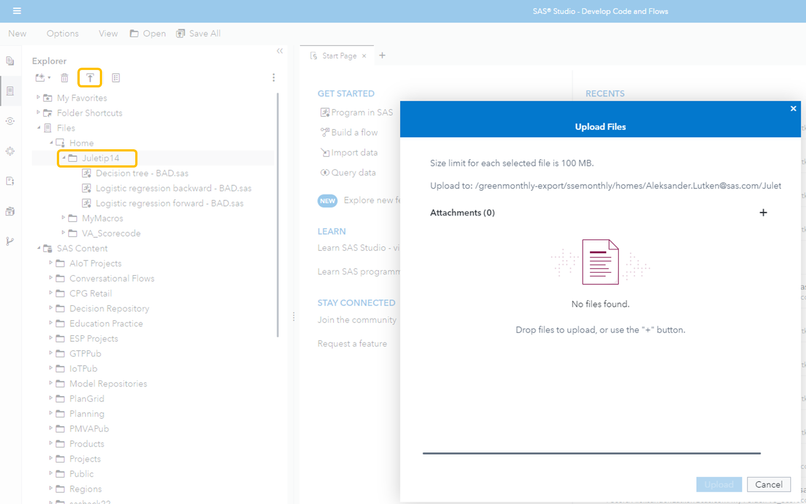
Drag and drop your score code file and select "Upload". You will then see the file in your folder.
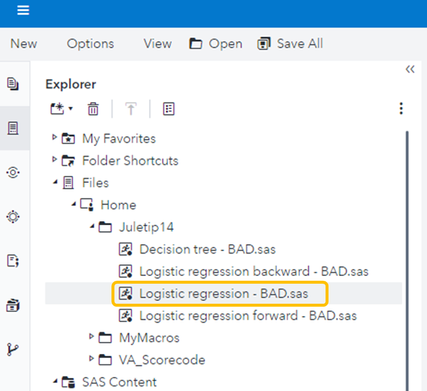
4. The score code is now uploaded and ready to use. The code will look something like this:
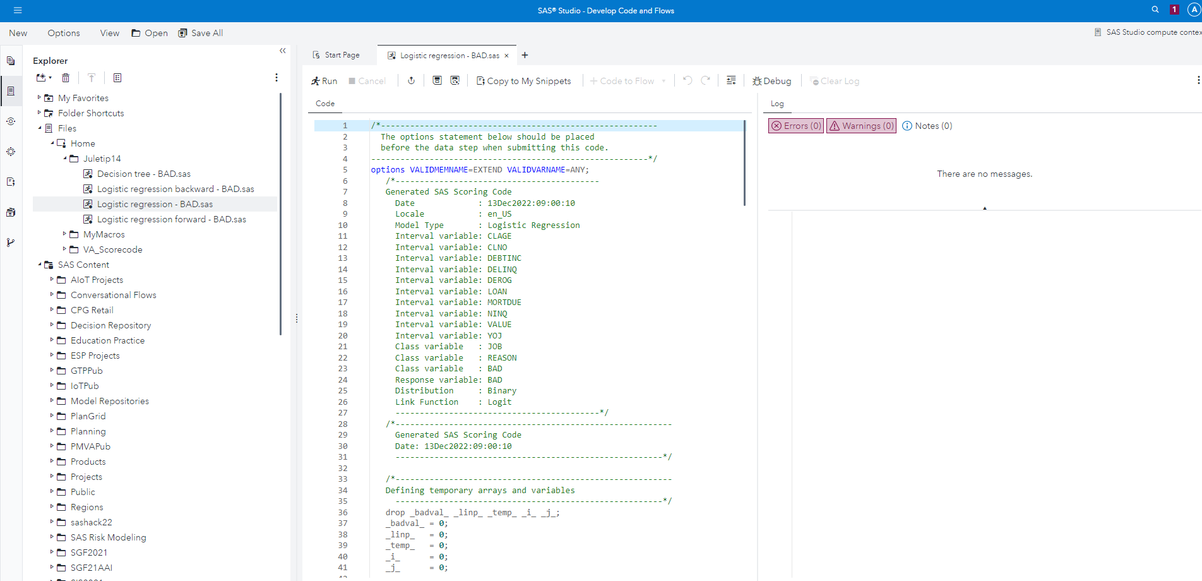
All you have to do, to run this score code on new data, is to wrap it in a data step.
In the top of the code (line 1) I will add:
/* Create cas connection */

cas;
caslib _all_ assign;


/* The dataset that I will score is called pddata_2_q2 and is located in a library called casuser */
/* Remember that I trained my model on Q1 and are now scoring on Q2. The result table will be called q2_scored */

data casuser.q2_scored;
set casuser.pddata_2_q2;
I will need to close the data step, and I also want to print out some of the results. I will therefore add this to the end of the code:
/* closing the datastep */

run;


/* print out 15 observations from the result table */

proc print data=casuser.q2_scored (obs=15);
run;
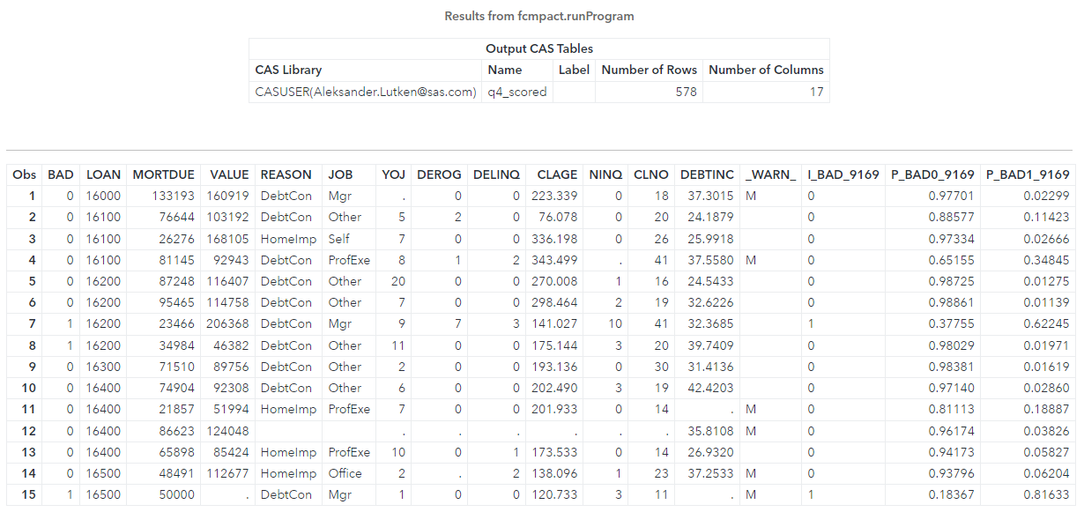
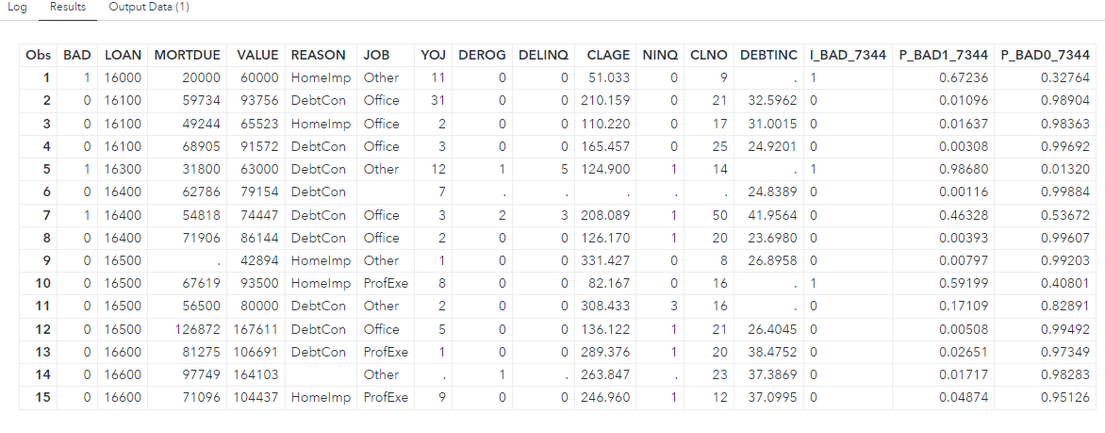
This will print out 15 observations with both the input values and the output values.
The output values are:
P_BAD1... = probability of the target variable "BAD" being equal to 1.
P_BAD0... = probability of the target variable "BAD" being equal to 0.
I_BAD... = 1 if the P_BAD1 value is above a certain threshold and 0 if not.
The score code for the different "SAS Visual Statistics" models will look very alike. However, the "SAS Visual Data Mining and Machine Learning" models are more complex and the score code will look different.
Lets try to build a gradient boosting model by following the same steps:
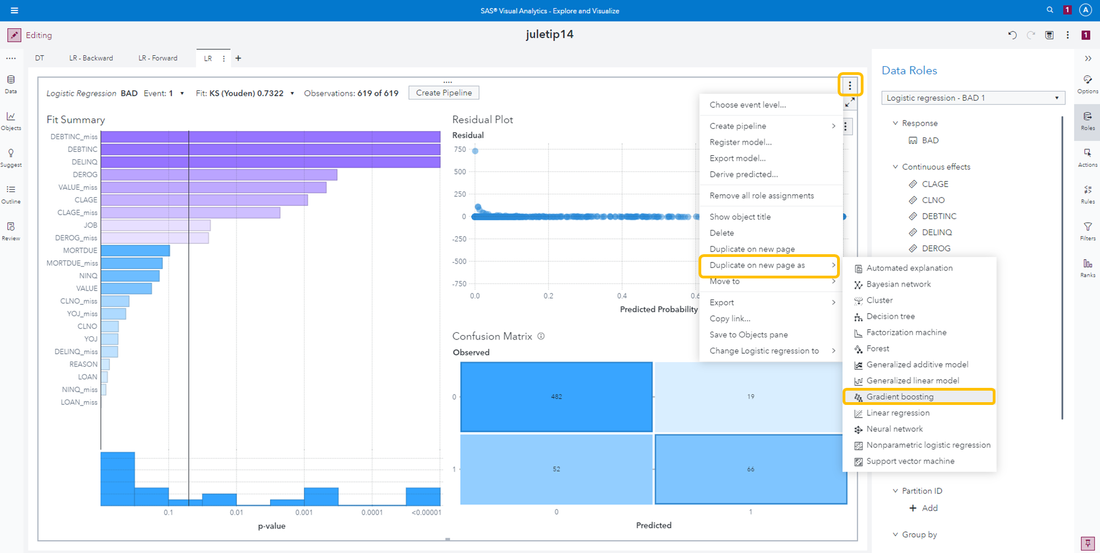
1. Lets start by duplicating our current model into a gradient boosting model like this: (since we are duplicating the model, it will use the same variables)
2. Exporting the score code is done the same way, but with an additional step:
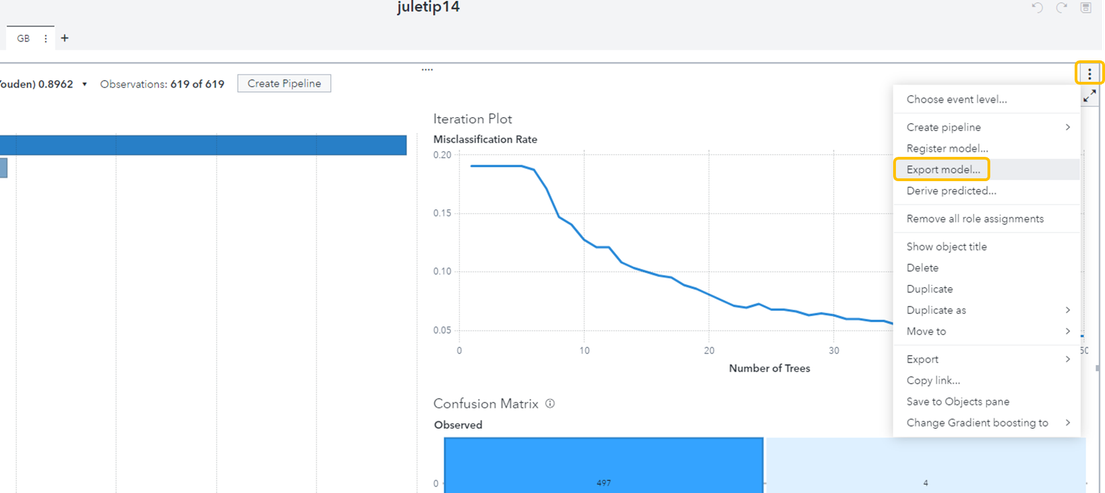
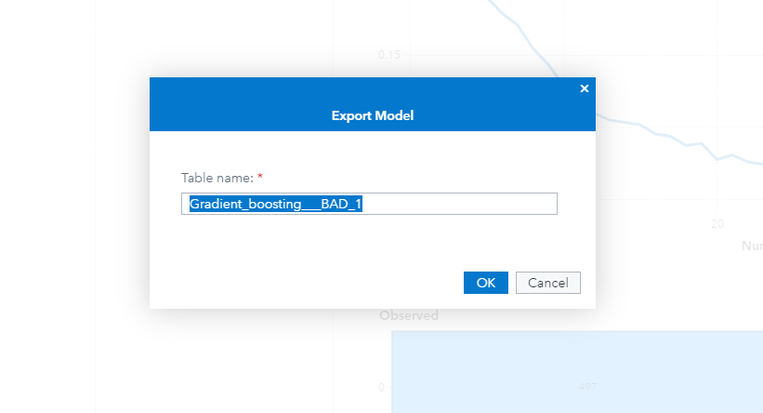
When selecting "Export model..." you will be told to create a table name for a table that will be saved in cas. This table will be called upon in the score code. Press "OK".
You will then be presented with the score code. This can either be copied and pasted into a program in SAS Studio or downloaded as a .sas file.
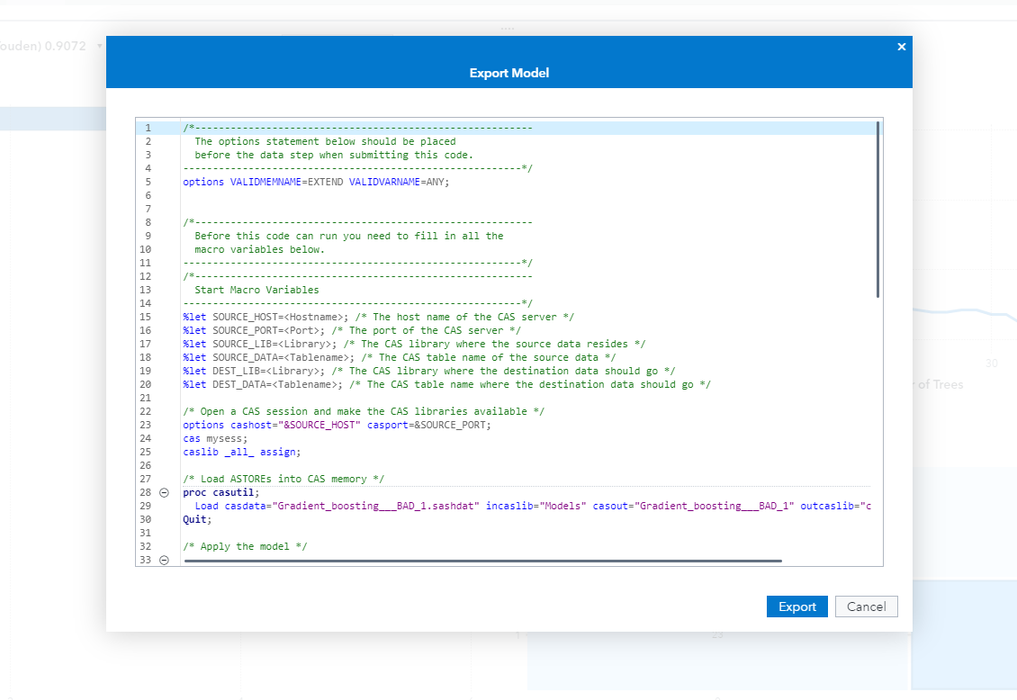
3. After I selected "Export" and opened SAS Studio, I can upload the file in my folder:
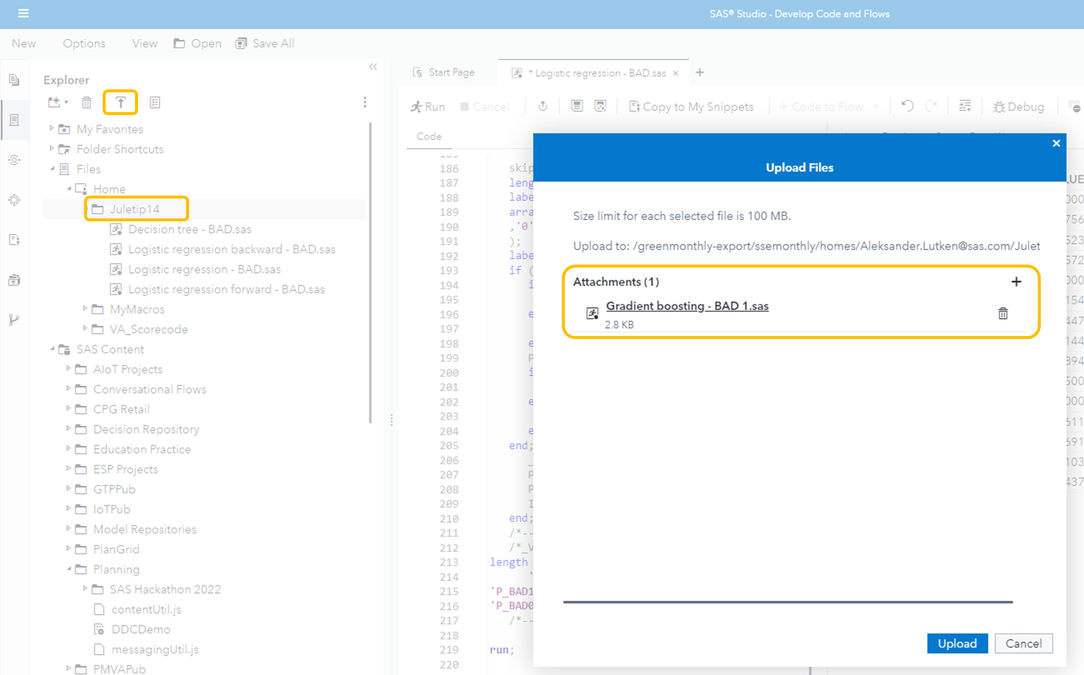
4. Once it is uploaded I can open it and do the necessary changes in order to use it to score on new data.
The score code will look something like this:
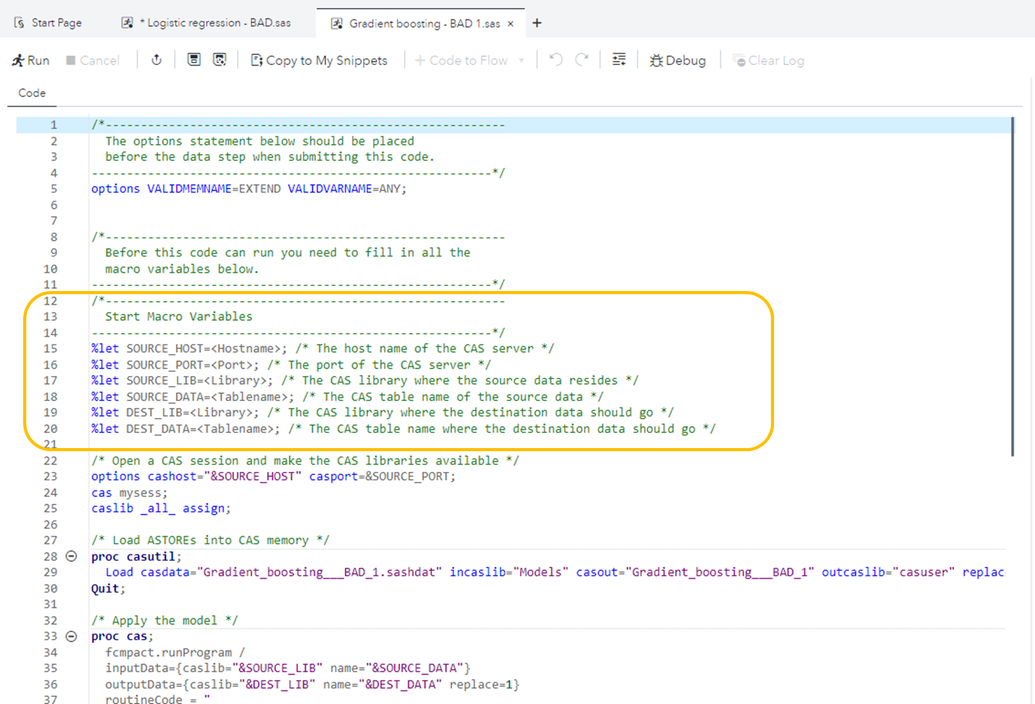
All you need to change are the macro variables that are in the orange square. These macro variables are used as input throughout the code.
Once the changes are done you can run the code to score the new dataset.
In the end of the code you can also add this procedure to print out some scored observations. Here I am also using the macro variables.
/* Print out sample of the results */

proc print data=&DEST_LIB..&DEST_DATA (obs=15);
run;
The output will look the same as for the previous score code, with both the input values and the predicted values. It will also present a table with information of where the results are saved, and how many rows and columns:
