- Home
- /
- SAS Communities Library
- /
- Supercharge your Column Management with the Manage Columns Step in SAS...
- RSS Feed
- Mark as New
- Mark as Read
- Bookmark
- Subscribe
- Printer Friendly Page
- Report Inappropriate Content
Supercharge your Column Management with the Manage Columns Step in SAS Studio 2023.12
- Article History
- RSS Feed
- Mark as New
- Mark as Read
- Bookmark
- Subscribe
- Printer Friendly Page
- Report Inappropriate Content
Step into the future of data management! With the recent release of SAS Viya (2023.12), the Manage Columns step has undergone a major upgrade, catapulting its functionality to a new level. From the ability to modify column data types, lengths, informats, and formats to creating entirely new columns, the possibilities have expanded significantly. Moreover, the option to output a view instead of a table adds a new layer of flexibility to your workflow. The upgraded Manage Columns step isn't just about features - it's a game-changer for migration from DI Studio to SAS Studio too.
The Manage Columns step is available in SAS Studio Basic, SAS Studio Analyst, and SAS Studio Engineer. These licenses also include the Query step, which encompasses functionality similar to the Manage Columns step, with the exception that the Manage Columns step allows for input and output CAS tables—a feature currently not available in the Query step.
Let’s demonstrate the enhanced features of the Manage Columns step by using a SAS table as input and a view as output, briefly assess the generated code and then compare it with code generated using CAS tables.
Enhanced functionalities
- To create a new flow, use the SAS Studio toolbar and select New > Flow
- Add the CARS SAS table to the new flow by clicking
(Libraries) in the navigation pane and expanding SASHELP. Right-click the CARS table and select Add to flow. Alternatively, you can drag the CARS table onto the flow canvas.
- Click
(Steps) in the navigation pane and, if necessary, expand Transform Data.
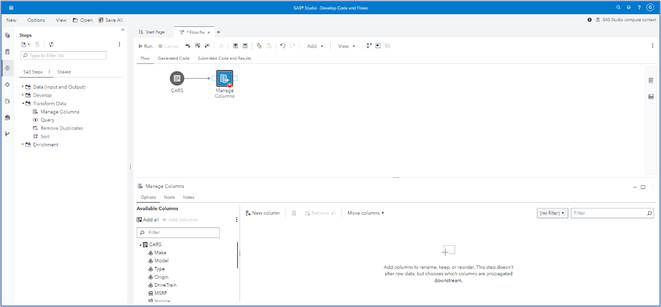
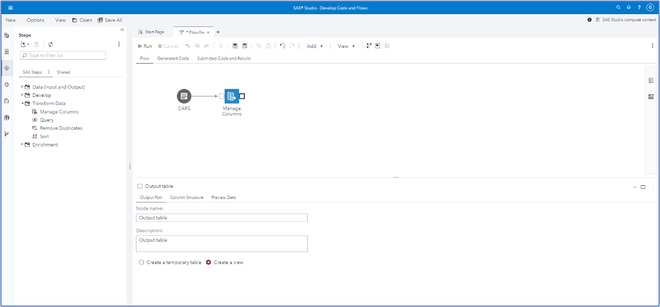
- Drag the Manage Columns step onto the CARS Table node until the mouse tool-tip changes to Connect to output port. The node details show the options for the Manage Columns node when selected.
Select any image to see a larger version.
Mobile users: To view the images, select the "Full" version at the bottom of the page.
- Click
(Maximize preview) on the node details to focus only on the node details
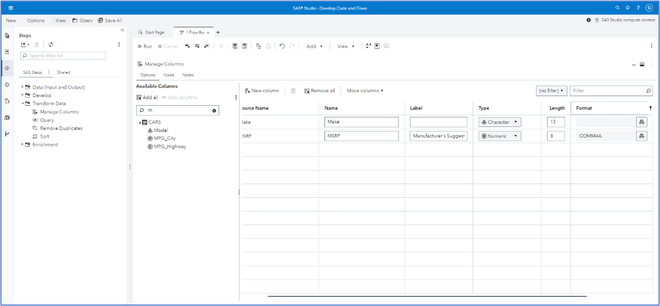
- In the Filter text field of the Available Columns pane, enter M. Double-click the Make and MSRP columns to add them to the Select tab.
- Add a label to the MSRP row of Manufacturer's Suggested Retail Price ($).
- Click
(Change Format) in the MSRP row and expand Numeric. Select COMMA, and assign an overall width of 8. Click OK.
- Click
(Clear filter text) in the Filter field to return to the full list of columns in the Available Columns pane.
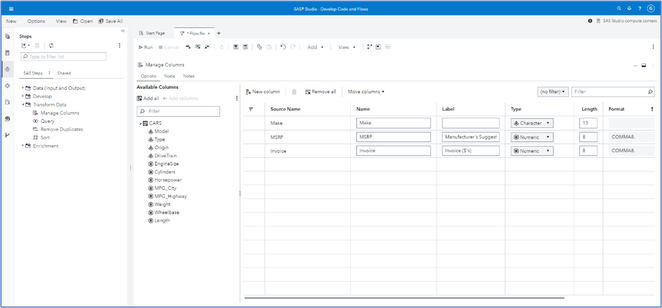
- Double-click the Invoice column to add it to the canvas. Alternatively, right-click Invoice and choose Add.
- Add a label to the Invoice row of Invoice ($).
- Click
(Change Format) in the Invoice row and expand Numeric. Select COMMA, and assign an overall width of 8. Click OK.
- Click New Column. The Edit Expression window appears. Here you can add data and functions to the expression box to create new columns.
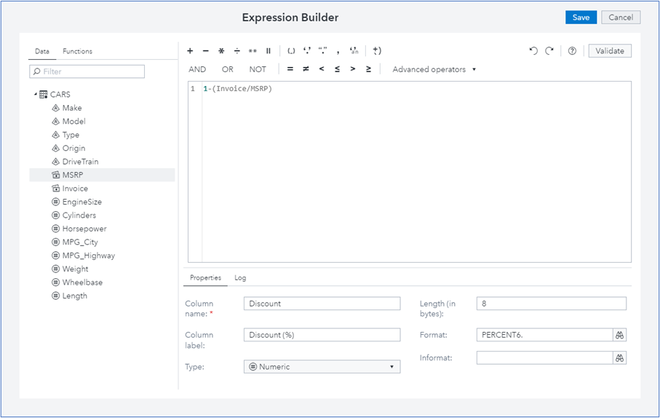
- In the expression box, enter 1-(. Notice the close bracket is also included. Use the Data tab on the left and double-click Invoice. Enter / and double-click MSRP.
- Enter Discount in the Column name text field and Discount (%) in the Column label.
- Use the drop-down box for Type and choose Numeric.
- Click
(Change Format) for the Format field and expand Numeric. In the Filter field enter per. The formats beginning with per are filtered. Select PERCENT and click OK.
- Click Save. The new column has been added to the list of columns to output.
- The order of the columns can be modified by selecting the columns and using the Move columns drop-down. I will leave them as is.
- Click
(Restore preview) to return the focus to the flow and node details.
- Select the output node of the Manage Columns node. Alternatively, you can add a Table step to the output node of the Manage Columns node.
- Select the Create a view radio button.
- Click
(Run entire flow).
- If necessary, click the output node of the Manage Columns node and select Preview Data.
- The view appears in the node details, with 4 columns and an unknown number of table rows. The view is a definition of a virtual data set. It contains the information required to access the data values and is stored separately from the data values.
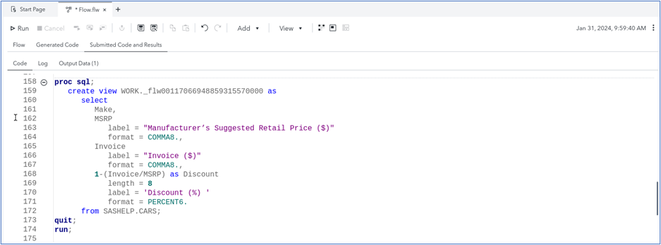
- Click Submitted Code and Results and scroll to line 158 (approximately). Notice the code generated is a Proc SQL.
Using CAS Tables.
Let’s substitute the input and output options with CAS tables. For demonstration purposes, I have simply uploaded the CARS table to the CASUSER CAS library using the following code:
cas;
caslib _all_ assign;

proc casutil;
load data=sashelp.cars outcaslib="casuser"
casout="cars";
run;
- Click Flow to return to the Flow.
- Select the CARS table node and click
(Library) in the Table node details.
- Double-click CASUSER and select CARS. Click OK.
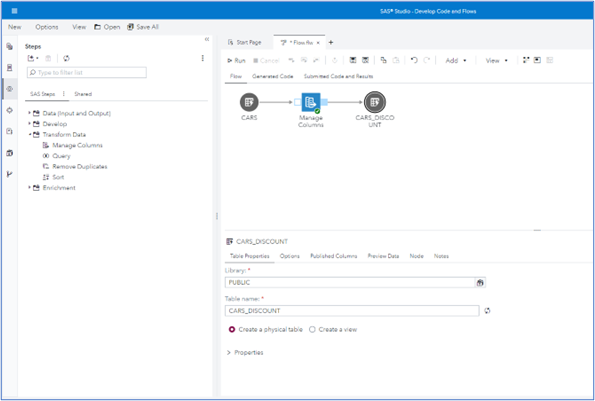
- Right-click the output port of the Manage Columns node and select Add a table.
- In the Table node details, click
(Library), double-click CASUSER, and name the table cars_discount. Click OK. Note the change in the Table node icon.
- Click
(Run entire flow).
- If necessary, click the cars_discount node and select Preview Data. The cars_discount table contains 428 rows and 4 columns. This table can now be used by other SAS Viya applications.
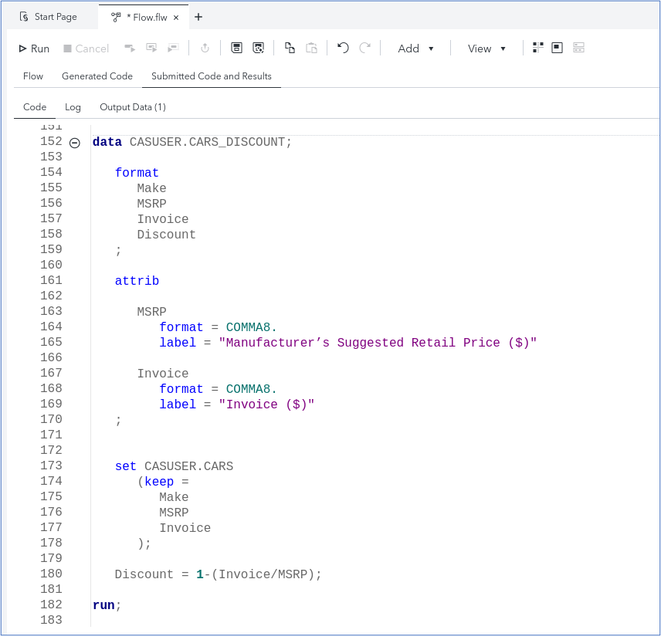
- Click Submitted Code and Results and scroll to line 152 (approximately). Notice the code generated is now a Data step.
Summary
To summarise:
- The enhanced features of the Manage Columns step empower you to effortlessly navigate, customize, and organize your columns with precision.
- The Manage Columns step supports CAS input and output tables. In cases where both input and output tables are in CAS format, the step will automatically generate DATA STEP code, as PROC SQL lacks support for scenarios where both input and output tables are in CAS.
Other notes:
- Reducing output column lengths in the Manage Columns step may result in truncated values. The generated log will include a SAS note indicating the truncated target columns.
- The icon of a Manage Columns step enables you to ascertain, at a glance, the purpose of the node. However, for broader data manipulation requirements on SAS tables, the Query step is recommended.
Here are some other methods of managing columns in SAS Studio on the SAS Viya Platform.
| Manage Columns Step | Query Step | Stand-alone Query | Table Viewer | |
| Select and Order Output Columns | ✔ | ✔ | ✔ | ✔ |
| Modify Output Column Names | ✔ | ✔ | ✔ | |
| Modify Output Column Labels | ✔ | ✔ | ✔ | |
| Modify Output Length | ✔ | ✔ | ✔ | |
| Modify Output Informat | ✔ | ✔ | ✔ | |
| Modify Output Format | ✔ | ✔ | ✔ | |
| Group Rows | ✔ | ✔ | ||
| Filter Groups | ✔ | ✔ | ||
| Join Tables | ✔ | ✔ | ||
| Filter Rows | ✔ | ✔ | ✔ | |
| Sort Rows | ✔ | ✔ | ✔ | |
| Remove Duplicate Rows | ✔ | ✔ | ✔ | |
| Remove Duplicates by Sort Columns | visible columns only | |||
| Calculate Columns | ✔ | ✔ | ✔ | |
| Create a View | ✔ | ✔ | ✔ | |
| Create a SAS Table | ✔ | ✔ | ✔ | |
| Create a Report | ✔ |
Reference
Thanks go to @ChrisLysholm of SAS R&D for editing, contributions and valuable suggestions for improvements of this article.
Find more articles from SAS Global Enablement and Learning here.
- Mark as Read
- Mark as New
- Bookmark
- Permalink
- Report Inappropriate Content
Thanks for sharing, @GemmaR . This is very interesting, especially the summary table at the end. Thanks to David Weik's Change report with its filtering capabilities ( https://criptic.github.io/SAS-Whats-New/index.html ) I could trace back this Column feature to Viya Stable 202312 version (LTS can only refer to 202303 or 202310 bi-annual releases); next LTS in 2024 will also use this feature presumably.
- Mark as Read
- Mark as New
- Bookmark
- Permalink
- Report Inappropriate Content
Hi @ronan , thank you so much for reaching out! You are, of course, correct and I have updated the article accordingly. My apologies for the oversight.

Register Today!
Join us for SAS Innovate 2025, our biggest and most exciting global event of the year, in Orlando, FL, from May 6-9. Sign up by March 14 for just $795.
Free course: Data Literacy Essentials
Data Literacy is for all, even absolute beginners. Jump on board with this free e-learning and boost your career prospects.
Get Started
- Find more articles tagged with:
- GEL
- sas studio
- SAS Viya
