- Home
- /
- Analytics
- /
- Stat Procs
- /
- How to rotate the y axis of all plots
- RSS Feed
- Mark Topic as New
- Mark Topic as Read
- Float this Topic for Current User
- Bookmark
- Subscribe
- Mute
- Printer Friendly Page
- Mark as New
- Bookmark
- Subscribe
- Mute
- RSS Feed
- Permalink
- Report Inappropriate Content
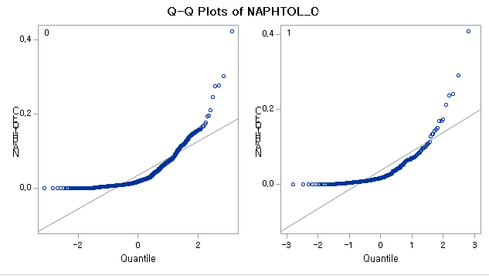
Hi, I am experiencing a problem where all of the letters of the y axis are not rotated erroneously.
For example, the alphabetical letters of the variable NAPHTOL_C would be shown up in the usual way, but the writing direction would also be vertical, and thus colliding with eachother causing difficulties in reading.
I tried to find out how to rotate the texts in an output graph, but as for my knowledge such rotating options exist for only some procedures, such as PROC SGPLOT.
However, the above problem is not limited to one type of output, but on all graphic outputs.
Is there an universal option where I can fix such a problem?
Thank you!
- Mark as New
- Bookmark
- Subscribe
- Mute
- RSS Feed
- Permalink
- Report Inappropriate Content
Are you saying that you wish to plot the label for all Y axes for all plots so that the text is vertical, such as
N
A
P
H
T
O
L
_
C
This is sometimes called "hotel text".
If that is what you want, it isn't possible to do this automatically. Although graphs support rotating tick values (FITPOLICY=STACKEDALWAYS), the labels do not support that kind of display.
April 27 – 30 | Gaylord Texan | Grapevine, Texas
Registration is open
Walk in ready to learn. Walk out ready to deliver. This is the data and AI conference you can't afford to miss.
Register now and lock in 2025 pricing—just $495!
ANOVA, or Analysis Of Variance, is used to compare the averages or means of two or more populations to better understand how they differ. Watch this tutorial for more.
Find more tutorials on the SAS Users YouTube channel.


