Hi good day everyone,
I am a at the moment trying to figure out how to go about calculating the Lakonishok, Shleifer and Vishny (1992) measure for determining the degree of investor herding behavior in a stock market. The SAS data file I am using consists of the variables: stock symbol (ticker), the volume traded (tvol), trade price (tprice), the trade value (tval), the client who initiated the trade (client), trade date (tdate), the time of the trade (rt), the sign indicating whether the trade initiated was a buy/sell (sign) as well as industry sector (sector) and the market the stock traded belongs to (market).
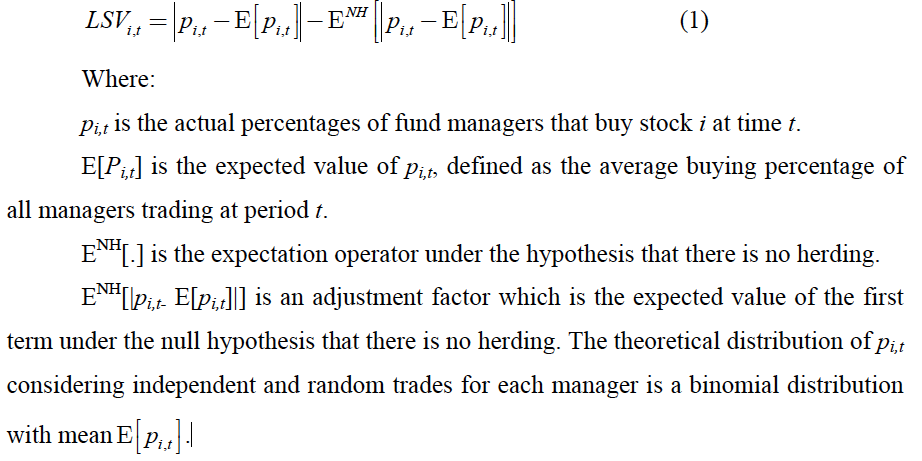
The LSV (1992) measure is as follows:
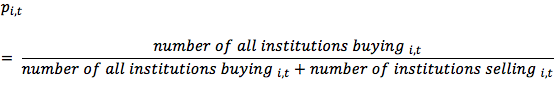
Thus far I believe I have been able to calculate P(i,t), using the below formula
and after much help, the sas code I used to find P(i,t):
data a (drop = market buyer seller tdate);
set TMP1.ttsetrades(where = (market = 'First Tier'));
timePeriod = intnx("WEEK", tdate, 0);
format timePeriod date9.;
run;
proc sort data=a;
by ticker timePeriod client;
run;
data b(drop=tvol sign);
do until (last.client);
set a;
by ticker timePeriod client;
stvol = sum(stvol, tvol*sign);
end;
run;
data Pit (keep=timePeriod ticker buyingClients totalClients herding);
buyingClients = 0; totalClients = 0;
do until(last.timePeriod);
set b;
by ticker timePeriod;
buyingClients + (stvol > 0);
totalClients + (stvol ne 0);
end;
Pit = buyingClients/totalClients;
run;
I am stuck as to how to proceed from this point, any help given will be so much appreciated.
Thank you
A


.jpg")

