Greetings,
I just created a very simple survival chart (code & cart are attached) and was trying to change the colors from "red" and "blue" into something else, like "purple" and "orange".
Would anyone tell me where I did wrong?
I tried to following the instructions from the following link; however, those colors are still remain the same.
http://support.sas.com/documentation/cdl/en/statug/63962/HTML/default/viewer.htm#statug_templt_a0000...
Thank you for all of the support!
Lindsey
--**********
ods graphics on;
proc template;
define style Styles.StatColor;
parent = Styles.HTMLBlue;
style GraphData1 from GraphData1 / contrastcolor = purple;
style GraphData2 from GraphData2 / contrastcolor = orange;
end;
run;
ods listing style=StatColor;
proc lifetest data = sorted_raw_data alpha = 0.05 plots(only) = survival(cl);
time miles * censored(0);
by truck;
strata population;
run;
proc template;
delete Styles.StatColor;
run;
ods graphics off;
--**********
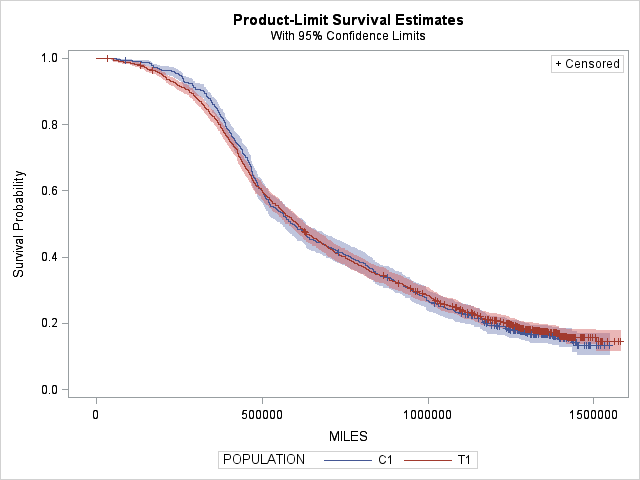
I tried to following the instructions from the following link; however, those colors are still remain the same.
http://support.sas.com/documentation/cdl/en/statug/63962/HTML/default/viewer.htm#statug_templt_a0000...
Thank you for all of the support!