- Home
- /
- SAS Viya
- /
- Visual Analytics
- /
- Using Graph Builder with Variable Column name
- RSS Feed
- Mark Topic as New
- Mark Topic as Read
- Float this Topic for Current User
- Bookmark
- Subscribe
- Mute
- Printer Friendly Page

- Mark as New
- Bookmark
- Subscribe
- Mute
- RSS Feed
- Permalink
- Report Inappropriate Content
Hi,
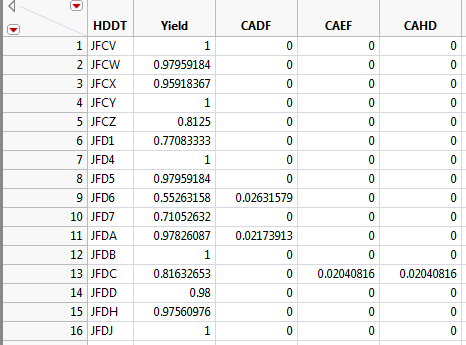
Sample Data Table:
My script is like this,
tt = Graph Builder(
Show Control Panel( 0 ),
Variables(
X( :HDDT ),
Y( :Yield, Side( "Right" ) ),
Y( :CAEF, Position( 1 ) ),
Y( :CAHD, Position( 1 ) )
),
Elements(
Bar(
X,
Y( 2 ),
Y( 3 ),
Y( 4 ),
Legend( 1 ),
Jitter( 1 )
),
Points( X, Y( 1 ), Legend( 2 ), Jitter( 1 ) )
)
)
But then, only Column "HDDT" and "Yield" is the fixed name for every data I will gather. Columns with "CA**" will change every batch of data.
So I want to create a script that these columns of "CA**" will be variable.
Currently, I create a script like this,
For (i=3,i<=ncols,i++,
tt = Graph Builder(
Show Control Panel( 0 ),
Variables(
X( :HDDT ),
Y( :Yield, Side( "Right" ) ),
Y( :Column(i),Position( 1 ))
),
Elements(
Points(
X,
Y( i ),
Legend( 1 ),
Jitter( 1 )
),
Points( X, Y( 1 ), Legend( 2 ), Jitter( 1 ) )
)
)
But the result, instead of 1 graph will appear, each "Y variable" is coming out.
Is there a best way? Thank you for the help. ^_^

- Mark as New
- Bookmark
- Subscribe
- Mute
- RSS Feed
- Permalink
- Report Inappropriate Content
Hi there! I moved your question to the SAS Visual Analytics community, where experts there are more likely to be able to help.
Register now for SAS Innovate! Join your SAS user peers in Las Vegas on April 16-19 2024.

- Mark as New
- Bookmark
- Subscribe
- Mute
- RSS Feed
- Permalink
- Report Inappropriate Content
- Mark as New
- Bookmark
- Subscribe
- Mute
- RSS Feed
- Permalink
- Report Inappropriate Content
Thank you ! I'll move it over there. Appreciate your depth of knowledge and the way you keep an eye on things in here!
Register now for SAS Innovate! Join your SAS user peers in Las Vegas on April 16-19 2024.
- Mark as New
- Bookmark
- Subscribe
- Mute
- RSS Feed
- Permalink
- Report Inappropriate Content
Happy to help...

- Mark as New
- Bookmark
- Subscribe
- Mute
- RSS Feed
- Permalink
- Report Inappropriate Content
I'll answer here, but note there is a separate JMP Community where more JMP experts will see your questions.
Yes, your script is launching Graph Builder 3 times. You need to somehow construct a single script which accounts for the variable number of columns and then run that script. JSL supports that kind of meta-programming (a script that creates another script) using the functions Expr(), Name Expr() and Eval Expr().
Below is an example like what I think you are trying to do.
// a table with lots of columns
dt = Open( "$SAMPLE_DATA/Decathlon.jmp" );

// an expression for the graph's variables
vars = Expr( Variables( X( :Country ), Y( :Score, Side( "Right" ) ) ) );

// an expression for Points elements
points = Expr( Points( X, Jitter( 1 ) ) );

// a loop to programmitically insert variables into those expressions
first col = 4;
last col = 6;
For( i = first col, i <= last col, i++,
  Insert Into( vars, Eval Expr( Y( Expr( Column( dt, i ) ), Position( 1 ) ) ) );
  Insert Into( points, Eval Expr( Y( Expr( i - first col + 2 ) ) ), 1 + i - first col );
);
//Show( vars, points );

// build the Graph Builder expression from those
gb = Eval Expr(
  Graph Builder(
  Show Control Panel( 0 ),
  Expr( Name Expr( vars ) ),
  Elements( Expr( Name Expr( points ) ), Line( X, Y( 1 ) ) )
  )
);
//show( gb );

gb; // execute the expression

Don't miss out on SAS Innovate - Register now for the FREE Livestream!
Can't make it to Vegas? No problem! Watch our general sessions LIVE or on-demand starting April 17th. Hear from SAS execs, best-selling author Adam Grant, Hot Ones host Sean Evans, top tech journalist Kara Swisher, AI expert Cassie Kozyrkov, and the mind-blowing dance crew iLuminate! Plus, get access to over 20 breakout sessions.
See how to use one filter for multiple data sources by mapping your data from SAS’ Alexandria McCall.

Find more tutorials on the SAS Users YouTube channel.
-
5 replies
-
04-10-2015 04:10 AM
-
2631 views
-
2 likes
-
4 in conversation
-
