- Home
- /
- SAS Viya
- /
- Visual Analytics
- /
- Re: DATE
- RSS Feed
- Mark Topic as New
- Mark Topic as Read
- Float this Topic for Current User
- Bookmark
- Subscribe
- Mute
- Printer Friendly Page

- Mark as New
- Bookmark
- Subscribe
- Mute
- RSS Feed
- Permalink
- Report Inappropriate Content
Hi! All,
I want to calculate how many days remaining in this month, for example i have date field with last updated date (20th Jan, 2014), i want to find out remaining days in this month (Jan). is there any way to do this.
Thanks,
Teja Surapaneni.

- Mark as New
- Bookmark
- Subscribe
- Mute
- RSS Feed
- Permalink
- Report Inappropriate Content
days=intnx('month',datecol,0,'end')-datecol;

- Mark as New
- Bookmark
- Subscribe
- Mute
- RSS Feed
- Permalink
- Report Inappropriate Content
Hello,
data _null_;
have=today();
want=intck('day',have,intnx('month',have,0,'e'));
put want=;
run;

- Mark as New
- Bookmark
- Subscribe
- Mute
- RSS Feed
- Permalink
- Report Inappropriate Content
Hi,
Dates in SAS are stored as numbers.
For your problem, you can create a new column defined as "'31JAN2015'd - datevariable" which gives you the days remaining in this month, provided datevariable is in numerical or date format.

- Mark as New
- Bookmark
- Subscribe
- Mute
- RSS Feed
- Permalink
- Report Inappropriate Content
Please as dates are saved like numbers how do you show them in the table list or graphics lines?
Because I can´t assign the format in other place
thnaks

- Mark as New
- Bookmark
- Subscribe
- Mute
- RSS Feed
- Permalink
- Report Inappropriate Content
Hi Silin,
dates are represented in a date format but at the end they are just a number.
So you can decide for yourselves if you want a date format or transform the date to a number
and use a numeric format. (Using a new calculated field)
question is, what is your goal to reach using the available tools.
hope this helps a little.
greetings

- Mark as New
- Bookmark
- Subscribe
- Mute
- RSS Feed
- Permalink
- Report Inappropriate Content
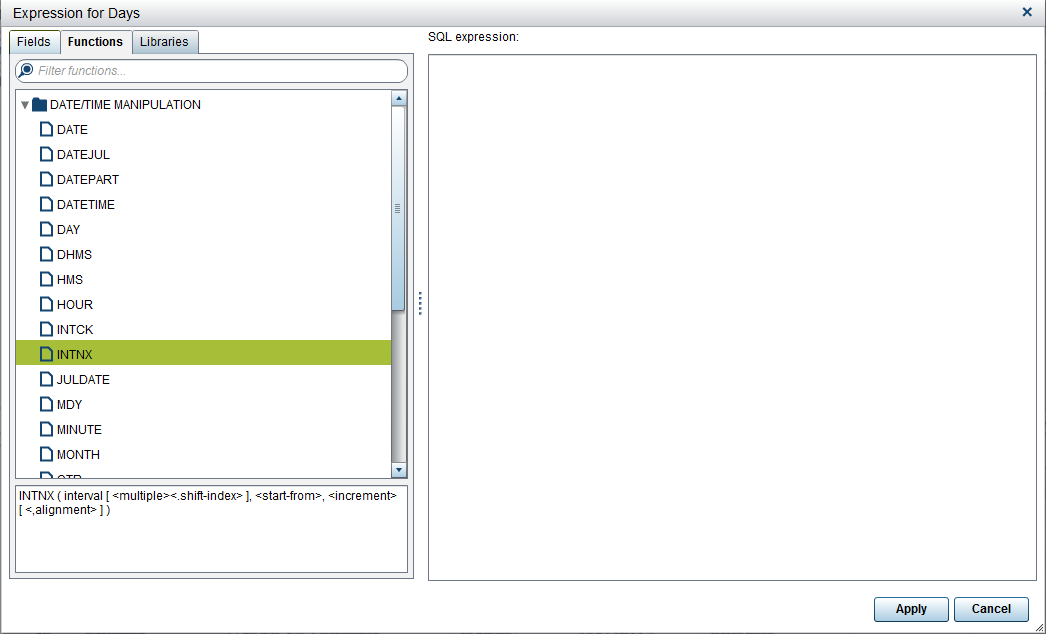
Hi Teja,
It may be best to do the processing prior to loading the data into SAS Visual Analytics if you want to use the intnx function. As you can see in the screenshot this function is not available within the Calculated Data Item expression builder
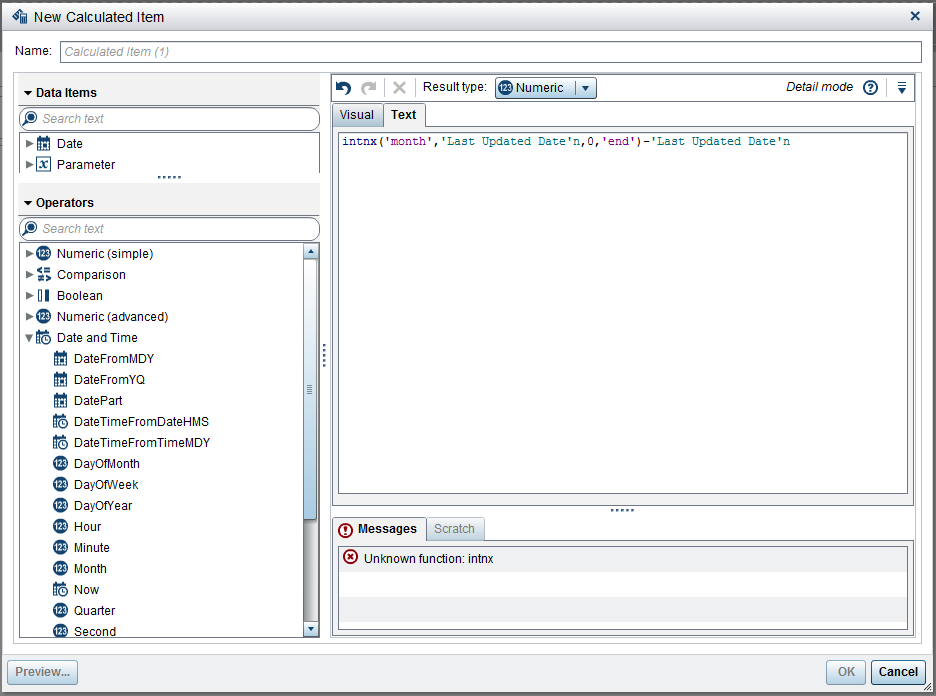
As suggests you could convert the data item to its number and do a numeric calculation. Note if you import the data from Excel it uses the Excel format type to determine its metadata type in SAS Visual Analytics.
Alternatively, you could use SAS Visual Analytics Data Builder to create a query to create an expression for your new Days column as the intnx function is available there as per the screenshot below
Kind Regards,
Michelle
- Mark as New
- Bookmark
- Subscribe
- Mute
- RSS Feed
- Permalink
- Report Inappropriate Content
Hi All, Thanks for your valuable suggestions,
Hi Michelle, Present don't have permission to access data query builder, i have permission to access only Reports, is there any way to this in reports (Version 6.4). Every Month i am creating manually new date variable 'Month end' (31st Jan 2015), and then i will convert the two date variables'MAX DATE' (20th JAN 2015), 'MONTH END'(31st JAN 2015) into numeric using treatas function, after that i will subtract the two numeric dates then i can easily get answer changing Aggregation to MAX in Properties Tab. but my problem is every month it will be automated, is there any way to do this in reports environment.
Thanks,
Teja Surapaneni.
- Mark as New
- Bookmark
- Subscribe
- Mute
- RSS Feed
- Permalink
- Report Inappropriate Content
Hi Teja,
I would want to automate the process too... Having access to the SAS Visual Analytics Data Builder will enable you to have a scheduled query that creates these columns and update your table. Alternatively, you could have a scheduled SAS process outside of the SAS Visual Analytics environment prior to the data load process.
Kind Regards,
Michelle
.jpg")
Catch up on SAS Innovate 2026
Nearly 200 sessions are now available on demand in the Innovate Hub.
Watch Now →See how to use one filter for multiple data sources by mapping your data from SAS’ Alexandria McCall.

Find more tutorials on the SAS Users YouTube channel.
-
8 replies
-
01-27-2015 01:31 AM
-
6972 views
-
4 likes
-
7 in conversation
-
