- Home
- /
- Analytics
- /
- Stat Procs
- /
- glimmix: binary logistic regression model - interpretation of residual...
- RSS Feed
- Mark Topic as New
- Mark Topic as Read
- Float this Topic for Current User
- Bookmark
- Subscribe
- Mute
- Printer Friendly Page

- Mark as New
- Bookmark
- Subscribe
- Mute
- RSS Feed
- Permalink
- Report Inappropriate Content
Hello all!
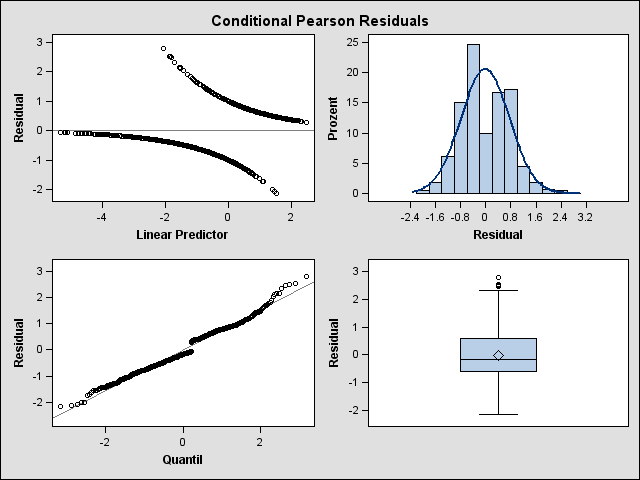
In a generalized linear mixed model ( http://communities.sas.com/message/104264#104264 ) I have used the plots= option (studentpanel pearsonpanel) to display residual diagnotics and check the assumptions of normality and homoscedasticity.
I do not quite know how to interpret the upper left plot where pearson residuals are plotted against the linear predictors (linear scale). When I googled on this topic, some sources say that model deviations cannot be seen in such a diagram unless the curves are smoothed by an appropriate method.
Hm, with a binary response variable, how is the plot supposed to look like ?
When I include a quadratic effect of the covariate (cf. glimmix code via link provided above), the panels look quite similar; the quadratic effect is significant, but the model fit does hardly change.

Thank you for any help, or readings to help me understand residual diagnostics in logistic regression.

- Mark as New
- Bookmark
- Subscribe
- Mute
- RSS Feed
- Permalink
- Report Inappropriate Content
This has come up a few times in this Discussion Forum. With purely binary response (0/1), the usual residual-diagnositic plots are not very useful. Books such as Collett (Modelling Binary Data) disucss this in some detail. There are more specialized graphs, but these are not part of the usual ODS graphics output. The upper left graph is caused by the fact the the response has only two possible values, but the predicted values are continuous. If you just consider the 0s, then you get one of those curves of points as the predictor (x) varies over the full range. Likewise, if you consider the 1s, you get the other curve of points. In other words, this graph does not tell you if the model is appropriate or not.
- Mark as New
- Bookmark
- Subscribe
- Mute
- RSS Feed
- Permalink
- Report Inappropriate Content
Thanks very much for the facts.
What kind of diagnostic graphs would be necessary to find out if the model is appropriate ?
Does SAS have any detailed information on that topic too ? I would be grateful for any help.

Don't miss out on SAS Innovate - Register now for the FREE Livestream!
Can't make it to Vegas? No problem! Watch our general sessions LIVE or on-demand starting April 17th. Hear from SAS execs, best-selling author Adam Grant, Hot Ones host Sean Evans, top tech journalist Kara Swisher, AI expert Cassie Kozyrkov, and the mind-blowing dance crew iLuminate! Plus, get access to over 20 breakout sessions.
ANOVA, or Analysis Of Variance, is used to compare the averages or means of two or more populations to better understand how they differ. Watch this tutorial for more.

Find more tutorials on the SAS Users YouTube channel.
-
2 replies
-
09-09-2011 03:31 PM
-
3198 views
-
3 likes
-
2 in conversation
-
