- Home
- /
- Analytics
- /
- Stat Procs
- /
- compute effect size
- RSS Feed
- Mark Topic as New
- Mark Topic as Read
- Float this Topic for Current User
- Bookmark
- Subscribe
- Mute
- Printer Friendly Page
- Mark as New
- Bookmark
- Subscribe
- Mute
- RSS Feed
- Permalink
- Report Inappropriate Content
hello,
I want to compute the effect size of a variable.
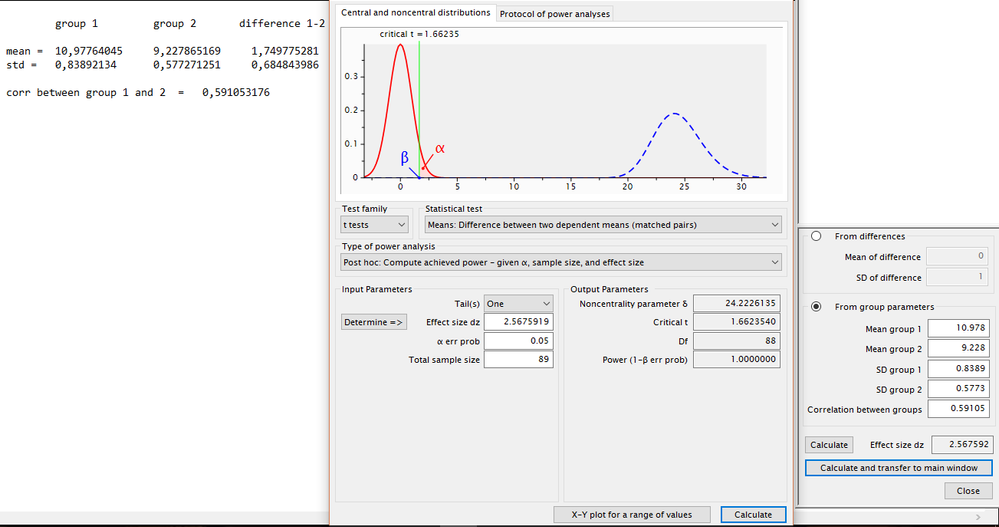
mean group1 = 10,978
mean group 2 = 9,228
standard deviation 1 = 0,8402
standard deviation 2 = 0,5767
correlation = 0,59105
I calculated the effecct size with g*power, but the result is 2,56. This is a very high value ?
Can I compute this in SAS with this given information, or am I doing something wrong?
greetings,
Aurélie
- Mark as New
- Bookmark
- Subscribe
- Mute
- RSS Feed
- Permalink
- Report Inappropriate Content
Do you have access to the raw data? What do you mean by EFFECT size? I'm used to see it in context of regression models not just summary statistics.
- Mark as New
- Bookmark
- Subscribe
- Mute
- RSS Feed
- Permalink
- Report Inappropriate Content
Assuming this paper is talking about the same thing you are, see the macro included.
- Mark as New
- Bookmark
- Subscribe
- Mute
- RSS Feed
- Permalink
- Report Inappropriate Content
hello,
thank you for the reaction. I have a dataset with 1 group measured 2 times, so I used a paired t-test. But as you see when I calculate this in g*power I get a huge effect size. The effect size that I get when using method 1 is different than when I use method 2.
METHOD 1
I compute first the effect size in g*power in the additional window (effect size = 2,56).
Then I use this value to calculate the power (power = 1).
METHOD 2
I first calculate the power in SAS (power = 0,9999).
Then I use this power value to calculate the effect size in G*power (effect size = 0,68)
Can somebody explain this?
greetings,
Aurélie
Don't miss out on SAS Innovate - Register now for the FREE Livestream!
Can't make it to Vegas? No problem! Watch our general sessions LIVE or on-demand starting April 17th. Hear from SAS execs, best-selling author Adam Grant, Hot Ones host Sean Evans, top tech journalist Kara Swisher, AI expert Cassie Kozyrkov, and the mind-blowing dance crew iLuminate! Plus, get access to over 20 breakout sessions.
ANOVA, or Analysis Of Variance, is used to compare the averages or means of two or more populations to better understand how they differ. Watch this tutorial for more.
Find more tutorials on the SAS Users YouTube channel.


