- Home
- /
- Analytics
- /
- Stat Procs
- /
- bootstrap estimates for a transistion matrix, was: migration probabil...
- RSS Feed
- Mark Topic as New
- Mark Topic as Read
- Float this Topic for Current User
- Bookmark
- Subscribe
- Mute
- Printer Friendly Page
- Mark as New
- Bookmark
- Subscribe
- Mute
- RSS Feed
- Permalink
- Report Inappropriate Content
Hello,
I am trying to determine estimates of migration probabilities using the cohort approach.
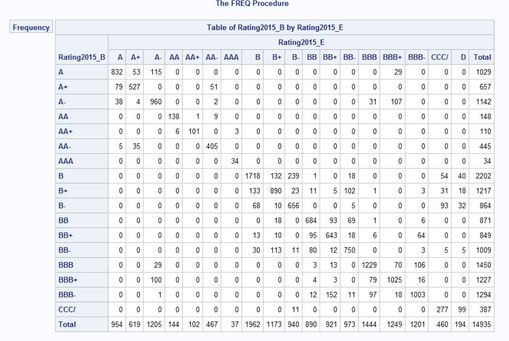
Here is the code I have so far to get the transition probabilities matrix and I would like some help in determining the probabilities of default for credit ratings.
Code:
Proc freq data = ratingdata;
Tables rating2015_B*Rating2015_E
/nopercent norow nocol;
Title ‘transition matrix’;
Run;
Here is the matrix:
Here is the credit rating dataset that I have attached.
thank you!
- Mark as New
- Bookmark
- Subscribe
- Mute
- RSS Feed
- Permalink
- Report Inappropriate Content
I take it that rating D is for default, since you only have a D column, but no D row. So if you want probabilities, rerun the PROC FREQ, but eliminate the "norow" option. Down the column D you'll see the probability of default, for each row.
Of course one of your problems is that the normal ascii sort sequence won't put your rating codes in order according the intended credit worthiness. Yes, the A's precede B's precede C's, but within A, they are not ordered as a credit analyst would want. Why do I bring this up? Because you might want to develop cumulative probabilities from the high credit score, including progressively weaker credit ratings. To see what I mean run
proc freq data = ratingdata;
  tables rating2015_e rating2015_B
    /nopercent norow cumcol;
  title ‘transition matrix’;
run;
Note I changed rating2015_b from the row variables to the column variable. This made using the "cumcol" option useful (there is no cumrow option). Of course, this would be much better if proc freq would order by actual credit worthiness.
The hash OUTPUT method will overwrite a SAS data set, but not append. That can be costly. Consider voting for Add a HASH object method which would append a hash object to an existing SAS data set
Would enabling PROC SORT to simultaneously output multiple datasets be useful? Then vote for
Allow PROC SORT to output multiple datasets
--------------------------
- Mark as New
- Bookmark
- Subscribe
- Mute
- RSS Feed
- Permalink
- Report Inappropriate Content
Thank you for your help. After that, I am trying to determine specifically:
using nonparametric bootstrap method (exclude the defaults) to generate 95% confidence intervals for default rates of each rating category.
Explore the relationship between the length of CIs and number of bootstrap samples and confidence level.
Do you have any idea how to proceed with this? I am a newbie with SAS, so I am unaware of how to code this and what functions I can use?
Thank you.
Don't miss out on SAS Innovate - Register now for the FREE Livestream!
Can't make it to Vegas? No problem! Watch our general sessions LIVE or on-demand starting April 17th. Hear from SAS execs, best-selling author Adam Grant, Hot Ones host Sean Evans, top tech journalist Kara Swisher, AI expert Cassie Kozyrkov, and the mind-blowing dance crew iLuminate! Plus, get access to over 20 breakout sessions.
ANOVA, or Analysis Of Variance, is used to compare the averages or means of two or more populations to better understand how they differ. Watch this tutorial for more.
Find more tutorials on the SAS Users YouTube channel.


