- Home
- /
- Analytics
- /
- Stat Procs
- /
- Spatial prediction applied to lymphoid follicles
- RSS Feed
- Mark Topic as New
- Mark Topic as Read
- Float this Topic for Current User
- Bookmark
- Subscribe
- Mute
- Printer Friendly Page

- Mark as New
- Bookmark
- Subscribe
- Mute
- RSS Feed
- Permalink
- Report Inappropriate Content
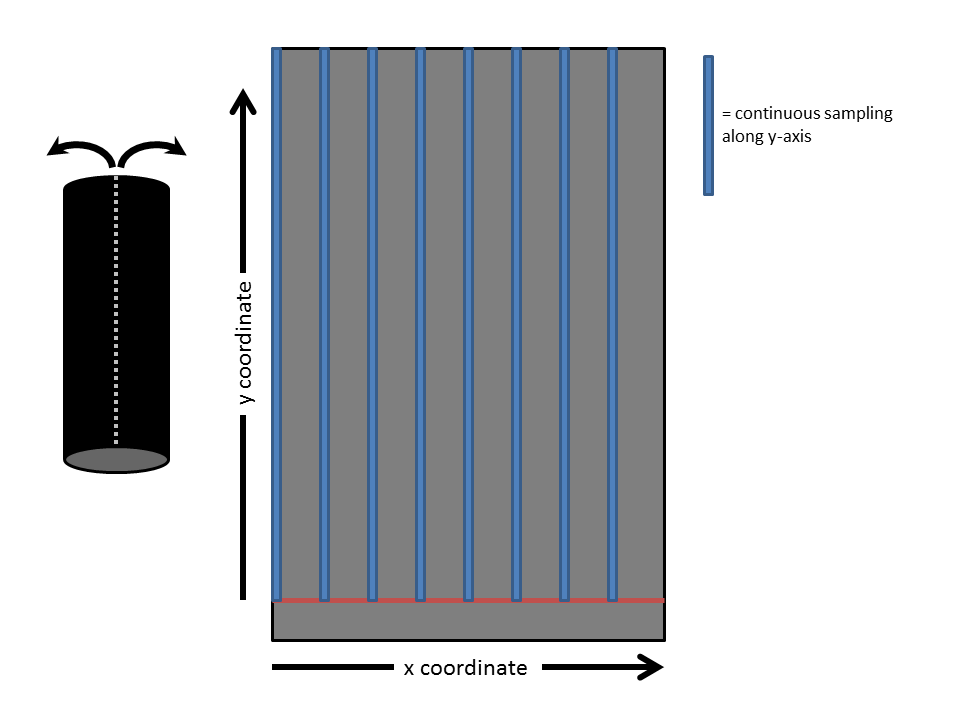
I'm looking for advice on approach and application to spatial prediction. I'm a life scientist trying to spatially predict morphologic measures of lymphoid follicles (such as frequency and area) in a specialized region of the intestinal track. The spatial reference is distance coordinates (x,y) from an anatomical landmark. The sampling strategy is shown above where the black tube on the left represents the intestinal segment which is opened along the dotted grey line to be layed out flat as shown to the right as a larger grey retangular shape. The red line is the anantomical landmark from which the distance along the y-axis can be measured continuously, the blue rectangles extending vertical from the landmark represent the tissue sample strip that is microscopically assessed for follicles. Since this was originally a tube, my first thought is to consider the x-axis values as discrete clock face positions. The goal is to use this sampling strategy to spatially predict at any x,y coordinate the frequency and area of follicules.
My plan has been to use kriging procedures available in SAS. While the SAS help documentation is a good start, I wonder if someone could point me to a reference that might go into more detail, especially when it comes to assumption checking and application in what may be an unusual application of this procedure to tissue morphometrics. I love learning from examples that might replicate the essential qualities of my sampling approach. Also welcome any guidence to approaches other than kriging. For example, can anyone help me compare kriging with stereologic approaches, is my sampling and statistical plan appropriate and/or analogous.
Thank you,
Dave

- Mark as New
- Bookmark
- Subscribe
- Mute
- RSS Feed
- Permalink
- Report Inappropriate Content
I found this SAS Global Forum paper to be readable:
Everything in Its Place: Efficient Geostatistical Analysis with SAS/STAT® Spatial Procedures
If you are up for a book-level treatment that is more theoretical and less code-oriented, I enjoyed reading Statistical Methods for Spatial Data Analysis by Schabenberger and Gotway. I think it is extremely well written.
- Mark as New
- Bookmark
- Subscribe
- Mute
- RSS Feed
- Permalink
- Report Inappropriate Content
Both look like excellent suggestions and what I need to start the ball rolling. I forgot to mention that I intend also to include a temporal factor (age of subject) as a separate research question. I see that the Amazon link you provided includes a suggested book "Statistics for Spatio-Temporal Data" and other similar titles are easily discovered. Looks like I've got my work cut out for me but its exciting to delve into a new area to solve these research questions. Thank you for your quick and helpful reply.

Don't miss out on SAS Innovate - Register now for the FREE Livestream!
Can't make it to Vegas? No problem! Watch our general sessions LIVE or on-demand starting April 17th. Hear from SAS execs, best-selling author Adam Grant, Hot Ones host Sean Evans, top tech journalist Kara Swisher, AI expert Cassie Kozyrkov, and the mind-blowing dance crew iLuminate! Plus, get access to over 20 breakout sessions.
ANOVA, or Analysis Of Variance, is used to compare the averages or means of two or more populations to better understand how they differ. Watch this tutorial for more.

Find more tutorials on the SAS Users YouTube channel.
-
2 replies
-
08-30-2012 12:45 PM
-
1241 views
-
1 like
-
2 in conversation
-
