- Home
- /
- Analytics
- /
- Stat Procs
- /
- PROC MIXED - How do I remove corner constraints (have no reference cat...
- RSS Feed
- Mark Topic as New
- Mark Topic as Read
- Float this Topic for Current User
- Bookmark
- Subscribe
- Mute
- Printer Friendly Page
- Mark as New
- Bookmark
- Subscribe
- Mute
- RSS Feed
- Permalink
- Report Inappropriate Content
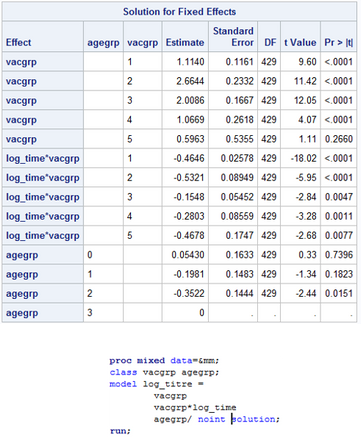
I'm trying to parameterise a simple model in such a way that there are no corner constraints in the Solution for Fixed Effects table. That is, so there are no reference groups and each parameter is its own estimate, rather than the difference from the last parameter. I thought the NOINT option would do this for me, and for the first photo, you can see I get what I want. I want to be able to interpret each parameter directly from the Solutions table, and then create my own contrasts if I choose to. You can see from photo 1 that I can remove the intercept and then use the ESTIMATE statement to determine the difference between the first and last vaccine group which gives me the same result in the left hand table which has the intercept included.
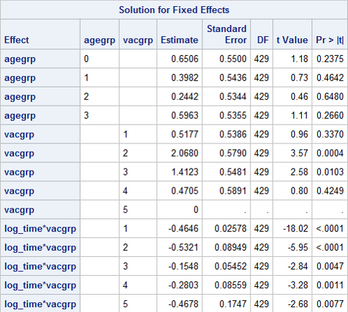
However, when I add another category, in this case, age, I now get the last category in the age group as a reference category as shown in the photo below. Is there any way I can parameterise the model so that each estimate in the table is the parameter estimate, rather than a contrast, so that there are no reference categories? I'm presuming it's because the model becomes overparameterized.
What's even more frustrating is that just changing the order of the covariates in the MODEL statement assigns the constraint to a different covariate, as shown below.
Accepted Solutions
- Mark as New
- Bookmark
- Subscribe
- Mute
- RSS Feed
- Permalink
- Report Inappropriate Content
It is much simpler to compute LSMEANS and then you can ignore the model coefficients.
Paige Miller
- Mark as New
- Bookmark
- Subscribe
- Mute
- RSS Feed
- Permalink
- Report Inappropriate Content
It is much simpler to compute LSMEANS and then you can ignore the model coefficients.
Paige Miller
- Mark as New
- Bookmark
- Subscribe
- Mute
- RSS Feed
- Permalink
- Report Inappropriate Content
And then, as a follow up to @PaigeMiller's suggestion, you can use the LSMESTIMATE statement to compute contrasts.
- Mark as New
- Bookmark
- Subscribe
- Mute
- RSS Feed
- Permalink
- Report Inappropriate Content
It does appear to be much simpler, but I'm not entirely sure why it would be better. Similarly, it's completely different to my REML estimates and these estimates are what PROC MIXED will use for predicting the marginal distribution as well as my BLUP estimates, so if they don't compare, why would I use LSMEANS? Or, alternatively, how do they relate to one another?
Also, LSMEANS won't work for my continuous time variable and as it's a longitudinal study, I'm not sure how to get around that.
Thanks,
Kieran
- Mark as New
- Bookmark
- Subscribe
- Mute
- RSS Feed
- Permalink
- Report Inappropriate Content
Okay, go back to your model coefficients. The coefficients when you have class variables are not unique; they can change depending on how the model is parameterized; however they all fit the data the same and produce the same predicted values. The different models you have computed are EQUIVALENT models, in the sense that they fit the same and give the same predicted values.
LSMEANS do work, they essentially remove the non-uniqueness of the coefficients (a very good thing to do!) because they are predicted values; and for your continuous variable, you need to determine the slope, so in that case you would look at the model coefficients.
Paige Miller
- Mark as New
- Bookmark
- Subscribe
- Mute
- RSS Feed
- Permalink
- Report Inappropriate Content
Perhaps you could get closer to what you want using
proc mixed data=&mm;
  class vacgrp agegrp;
  model log_titre = vacgrp*agegrp vacgrp*log_time / noint solution;
  run;
This gives you the intercepts for the combinations of vacgrp and agegrp, which are estimated at log_time=0. It's a fairly straightforward process to write contrasts for the vacgrp x agegrp means using this model.
If you want to estimate means at a specified value of the covariate, check out the documentation for the AT option for LSMEANS and LSMESTIMATE.
- Mark as New
- Bookmark
- Subscribe
- Mute
- RSS Feed
- Permalink
- Report Inappropriate Content
Thanks for your attention with this, Paige.
I've been reading and playing about with LSMEANS and it's starting to make much more sense now. It's also starting to seem appropriate and it's nice and simple to use. I've used the E option to get the L matrix output, but I'm slightly confused about what it's actually testing. Obviously the simple example of (1 -1 0) is testing the equivalence of b1 and b2. I can see that the matrix takes the average over the groups but I'm not sure what the actual test is. If you could help explain this, I think I will fully understand what's going on.
- Mark as New
- Bookmark
- Subscribe
- Mute
- RSS Feed
- Permalink
- Report Inappropriate Content
I'm not sure if this answers your question, but for the case where you compare b1 to b2, and similar cases, the documentation states
Assuming the LS-mean is estimable, PROC MIXED constructs an approximate t test to test the null hypothesis that the associated population quantity equals zero.
Paige Miller
Don't miss out on SAS Innovate - Register now for the FREE Livestream!
Can't make it to Vegas? No problem! Watch our general sessions LIVE or on-demand starting April 17th. Hear from SAS execs, best-selling author Adam Grant, Hot Ones host Sean Evans, top tech journalist Kara Swisher, AI expert Cassie Kozyrkov, and the mind-blowing dance crew iLuminate! Plus, get access to over 20 breakout sessions.
ANOVA, or Analysis Of Variance, is used to compare the averages or means of two or more populations to better understand how they differ. Watch this tutorial for more.
Find more tutorials on the SAS Users YouTube channel.


