- Home
- /
- Analytics
- /
- Stat Procs
- /
- Re: PROC GAM: Additive suboption with class statement
- RSS Feed
- Mark Topic as New
- Mark Topic as Read
- Float this Topic for Current User
- Bookmark
- Subscribe
- Mute
- Printer Friendly Page

- Mark as New
- Bookmark
- Subscribe
- Mute
- RSS Feed
- Permalink
- Report Inappropriate Content
Hi, experts!
I need your help about GAM procedure.
If I use the ADDITIVE suboption with class statement to get the additive component plots, estimates for the plots aren't reasonable.
Is there any solution?
proc gam data=dataset plots=component(additive);
class x0;
model y= param(x0) spline(x1) spline(x2) / link=Identity dist=normal method=GCV;
run;

- Mark as New
- Bookmark
- Subscribe
- Mute
- RSS Feed
- Permalink
- Report Inappropriate Content
What do you mean that the plots aren't reasonable? Can you give an example of what happens, and what you would expect?
Steve Denham
- Mark as New
- Bookmark
- Subscribe
- Mute
- RSS Feed
- Permalink
- Report Inappropriate Content
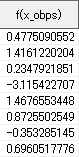
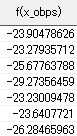
When model only included continuous variable,
estimates of additive component in the data from ods output SmoothingComponentPlot were like left table.
On the other hand, when model include categorical variable, estimates were like right table.
- Mark as New
- Bookmark
- Subscribe
- Mute
- RSS Feed
- Permalink
- Report Inappropriate Content
It appears that the right hand column is giving the difference from the reference level of x0, which in the default case would be the last level. Perhaps you could add the value of the last level (or its mean/median if the class collapses several values) to get values more like those on the left.
Steve Denham

Don't miss out on SAS Innovate - Register now for the FREE Livestream!
Can't make it to Vegas? No problem! Watch our general sessions LIVE or on-demand starting April 17th. Hear from SAS execs, best-selling author Adam Grant, Hot Ones host Sean Evans, top tech journalist Kara Swisher, AI expert Cassie Kozyrkov, and the mind-blowing dance crew iLuminate! Plus, get access to over 20 breakout sessions.
ANOVA, or Analysis Of Variance, is used to compare the averages or means of two or more populations to better understand how they differ. Watch this tutorial for more.

Find more tutorials on the SAS Users YouTube channel.
-
3 replies
-
11-19-2014 11:15 PM
-
1307 views
-
3 likes
-
2 in conversation
-
