- Home
- /
- Analytics
- /
- Stat Procs
- /
- Nonlinear regression
- RSS Feed
- Mark Topic as New
- Mark Topic as Read
- Float this Topic for Current User
- Bookmark
- Subscribe
- Mute
- Printer Friendly Page
- Mark as New
- Bookmark
- Subscribe
- Mute
- RSS Feed
- Permalink
- Report Inappropriate Content
Hi,
I am trying to make a linear regression but my data is heteroskedastic, so will have to do a nonlinear regression.
Could you please tell me what sas procedure is good for nonlinear regressions, and which will also find the right model because I have several variables and don't even know if any should be logarithmic or exponential for example.
I tried searching the internet but only got more confused...
Thank you
- Mark as New
- Bookmark
- Subscribe
- Mute
- RSS Feed
- Permalink
- Report Inappropriate Content
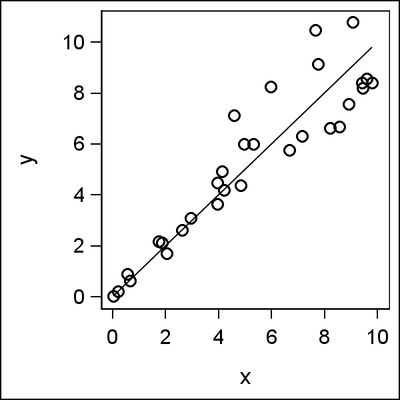
We need a lot more information about your data to suggest an appropriate statistical modeling approach. Nonlinear regression is not the most common way to deal with heteroskedasticity. Generally, if your data looks like this:
i.e. heteroskedastic because the standard deviation of the errors is not constant but proportional to the mean, then a logarithmic transformation of the dependent variable (y) is often a suitable approach.
- Mark as New
- Bookmark
- Subscribe
- Mute
- RSS Feed
- Permalink
- Report Inappropriate Content
Hi,
Thnak sfor the reply, I didn't answer for a while becasue I didn't knwo that I ha d areply, the new sas communities site doesn't send an email when there is a reply...
I tried transforming the y variable into log y (among others) but was still getting heteroskedasticity...
Please see what the y vs x graph and residual vs x graphs look like in the attached word doc (couldn't just copy and paste it here)
Thank you!
- Mark as New
- Bookmark
- Subscribe
- Mute
- RSS Feed
- Permalink
- Report Inappropriate Content
I really don't see much evidence for heteroskedasticity, especially in the plot of car3 vs ln_mkt. The residual plot does show some more variablity at low values of the independent variable, but this may be more a function of high influence points.
Consider using either PROC ROBUSTREG or PROC QUANTREG to fit the data.
(On the other hand, I don't see much use of the independent variable in these plots as a predictor. That regression line is nearly as flat as the Texas Panhandle).
Steve Denham
Don't miss out on SAS Innovate - Register now for the FREE Livestream!
Can't make it to Vegas? No problem! Watch our general sessions LIVE or on-demand starting April 17th. Hear from SAS execs, best-selling author Adam Grant, Hot Ones host Sean Evans, top tech journalist Kara Swisher, AI expert Cassie Kozyrkov, and the mind-blowing dance crew iLuminate! Plus, get access to over 20 breakout sessions.
ANOVA, or Analysis Of Variance, is used to compare the averages or means of two or more populations to better understand how they differ. Watch this tutorial for more.
Find more tutorials on the SAS Users YouTube channel.


