- Home
- /
- Analytics
- /
- Stat Procs
- /
- Re: Nonlinear Regression with clusters
- RSS Feed
- Mark Topic as New
- Mark Topic as Read
- Float this Topic for Current User
- Bookmark
- Subscribe
- Mute
- Printer Friendly Page
- Mark as New
- Bookmark
- Subscribe
- Mute
- RSS Feed
- Permalink
- Report Inappropriate Content
Hello all,
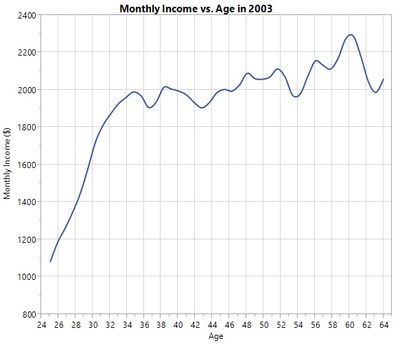
I have financial data of subjects that were chosen for a survey. The variable of interest (the dependent variable) is the subject's income. The main question, is to test the relation between the income and the age. Other covariates in the data are such as: marital status, gender, years of education and more. In addition, some subjects comes from the same family (probably the family was chosen by random, and if it contained only one subject over 18, he/she were chosen, and if more than one subjects, they all were chosen). I wish to create a model that will test the impact of age on the income, while controlling for the other covariates. But, looking at a plot of age vs. income, the relation looks non-linear. Theoretically, it should be parabolic, but in the data it is a bit different. I am attaching the plot so you can see. The plot is a smoothed line, since there are many observations with the same age, and a scatter is not very clear to understand.
I would like to ask your help in writting the SAS code for it. I understand that PROC NLMIXED is what I want. I am not sure how to model correctly (the formula, starting points, etc...).
Thank you in advance !
P.S. I can create a uniqe ID for each subject by connecting family ID and subject ID.
- Mark as New
- Bookmark
- Subscribe
- Mute
- RSS Feed
- Permalink
- Report Inappropriate Content
You are right that NLMIXED is the procedure to use for nonlinear models with clustering (subjects). But NLMIXED is essentially a programming language, and there is no simple way to give you advice at this point. The forum participants usually want to provide help with existing code (corrections, changes, etc.), and typically will not write out code from scratch. Plus, you are not sure about a model to use. I think you will have to first do some homework and learn a bit about NLMIXED, and then figure out some models that you think are appropriate. People on this forum can then give advice on ways to fix problems, and so on.
The SAS User's Guide can describe NLMIXED, but the book "SAS for Mixed Models, 2nd edition" is even better to learn about this procedure. In terms of models, I am sure that many have been proposed in the literature for this type of economic data.
Don't miss out on SAS Innovate - Register now for the FREE Livestream!
Can't make it to Vegas? No problem! Watch our general sessions LIVE or on-demand starting April 17th. Hear from SAS execs, best-selling author Adam Grant, Hot Ones host Sean Evans, top tech journalist Kara Swisher, AI expert Cassie Kozyrkov, and the mind-blowing dance crew iLuminate! Plus, get access to over 20 breakout sessions.
ANOVA, or Analysis Of Variance, is used to compare the averages or means of two or more populations to better understand how they differ. Watch this tutorial for more.
Find more tutorials on the SAS Users YouTube channel.


