- Home
- /
- Analytics
- /
- Stat Procs
- /
- How to get the time-series averages of the percentiels?
- RSS Feed
- Mark Topic as New
- Mark Topic as Read
- Float this Topic for Current User
- Bookmark
- Subscribe
- Mute
- Printer Friendly Page

- Mark as New
- Bookmark
- Subscribe
- Mute
- RSS Feed
- Permalink
- Report Inappropriate Content
Hi, I'm trying to calculate the statistics: minimum; 1 , 25 , 50 , 75 ,and 99 percentiles; maximum; and standard deviation which are the time-series averages of monthly cross-sectional statistic over the 12 month of each year. I'm using the following codes
proc means data=data_in min P1 P25 P50 P75 P99 max std;
var mret;
by year;
output out = data_out mean= min= P1= P25= P50= P75= P99= max= std= /autoname;
run;
But it just give me the actual quantile of the time-series data instead of the average of those quantile, in other word I would like to have the time-series average of the 50 percentile is the same as the mean of the time-series. My data are the time-series return data of more than1000 different stocks.
Thanks a lot in advance!

- Mark as New
- Bookmark
- Subscribe
- Mute
- RSS Feed
- Permalink
- Report Inappropriate Content
The code computes the statistics for MRET each unique YEAR value. Are you saying that you want the average of the statistics over the various years? If so, run PROC MEANS a second time:
proc means data=data_out mean;
run;
- Mark as New
- Bookmark
- Subscribe
- Mute
- RSS Feed
- Permalink
- Report Inappropriate Content
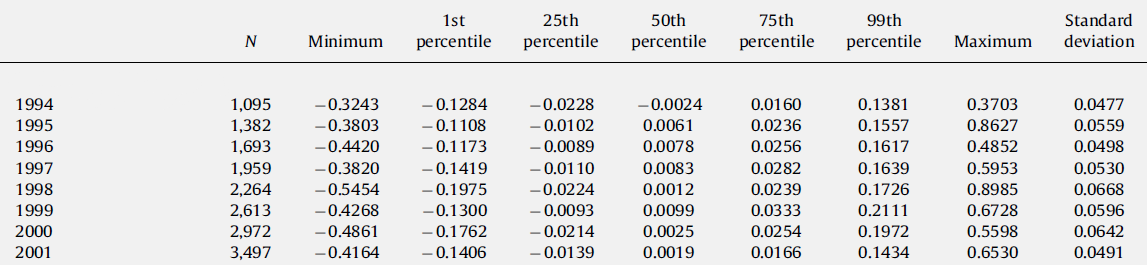
I would like to have the results like this. And the 50 percentile would be the same as the means of the cross-sectional time-serie data in that year. (N is the number of different stocks)

- Mark as New
- Bookmark
- Subscribe
- Mute
- RSS Feed
- Permalink
- Report Inappropriate Content
50th percentile is the median not the mean. For it to match the mean you need an exactly normal distribution, which is not likely.
You've shown what you want the results to look like, what results are you getting and what does your data look like.
- Mark as New
- Bookmark
- Subscribe
- Mute
- RSS Feed
- Permalink
- Report Inappropriate Content
Indeed I have for 50th percentile the median, not the mean. My results looks like this (with freg is the number of observations in that year). so those percentile are not the average of the percentiles themselves.

the results are the same for "CLASS year" and "BY year"
- Mark as New
- Bookmark
- Subscribe
- Mute
- RSS Feed
- Permalink
- Report Inappropriate Content
You need to explain more what you're trying to do. Start off with what your data looks like and then what output you would like.
- Mark as New
- Bookmark
- Subscribe
- Mute
- RSS Feed
- Permalink
- Report Inappropriate Content
The data that i have are the time-series data of monthly stocks return. The number of stocks varies per years from 100-800, there are in total more than 1000 stocks. I would like to have the time-serie averages of monthly cross-sectional statistics of those return over the 12 months of each year exactly like the one above.
But e.g. for the time-series average of the 50th percentiles in year 1980 I would like to have 4.1060 ( the mean) instead of 3.8642 (the median).
- Mark as New
- Bookmark
- Subscribe
- Mute
- RSS Feed
- Permalink
- Report Inappropriate Content
Sorry, it's still not clear to me.
If you want mean, specify mean= instead of p50=
Other than that you'll need to provide more details, sample input and sample output would be preferable.

- Mark as New
- Bookmark
- Subscribe
- Mute
- RSS Feed
- Permalink
- Report Inappropriate Content
hi, i am trying to do simialr thing. Can u please let me know how you have done it in SAS.
For reference, I m trying to calculate time series averages of cross-sectional means, medians, Standard deviations.
- Mark as New
- Bookmark
- Subscribe
- Mute
- RSS Feed
- Permalink
- Report Inappropriate Content
You ought to be able to get those results by using
CLASS year;
instead of
BY year;

Don't miss out on SAS Innovate - Register now for the FREE Livestream!
Can't make it to Vegas? No problem! Watch our general sessions LIVE or on-demand starting April 17th. Hear from SAS execs, best-selling author Adam Grant, Hot Ones host Sean Evans, top tech journalist Kara Swisher, AI expert Cassie Kozyrkov, and the mind-blowing dance crew iLuminate! Plus, get access to over 20 breakout sessions.
ANOVA, or Analysis Of Variance, is used to compare the averages or means of two or more populations to better understand how they differ. Watch this tutorial for more.

Find more tutorials on the SAS Users YouTube channel.
-
9 replies
-
04-02-2013 06:01 PM
-
2346 views
-
0 likes
-
4 in conversation
-
