- Home
- /
- Analytics
- /
- Stat Procs
- /
- Re: How to get axis values symmetrical SGPLOT
- RSS Feed
- Mark Topic as New
- Mark Topic as Read
- Float this Topic for Current User
- Bookmark
- Subscribe
- Mute
- Printer Friendly Page

- Mark as New
- Bookmark
- Subscribe
- Mute
- RSS Feed
- Permalink
- Report Inappropriate Content
I am losing my mind here. I just can not get the X axis on my SGPLOT to be symmetrical. I define values (-&count to &count by 5) in the xaxis statement and what happens is that SAS just randomly decides which of the values it should show for example the axis could be lik -11 -6 -1 4 9 14 which makes just no sense. I would need to get the axis to always contain 0 and then have symmetrically distributed value ticks around 0 witht the MIN/MAX value being at the end of the values list. How can I do this? Is there some style element that drives this? I have tried to force this by assigning also white reflines at the MIN and MAX points with noclip option but it does not work.

- Mark as New
- Bookmark
- Subscribe
- Mute
- RSS Feed
- Permalink
- Report Inappropriate Content
It would be helpful if you could post your code so we know what options you tried. Here is a program that works for simulated data. It uses the VALUES= option to set the axis tick locations:
data a;
do i = 1 to 100;
x = rand("normal");
y = rand("normal");
output;
end;
run;
proc sgplot data=a;
scatter x=x y=y;
xaxis values=(-5 to 5 by 5);
run;

- Mark as New
- Bookmark
- Subscribe
- Mute
- RSS Feed
- Permalink
- Report Inappropriate Content
It is not random, but based on THRESHOLD setting. These options on the axis decide if the outer tick values are actually shown based on the distance form the actual extreme value to the extreme tick value for the axis. With SAS 9.3, SGPLOT supports ThresholdMin and ThresholdMax. There is a ValueList option for you to always get the ticks you want. Set ValuesHint to indicate that only the values in the list that are actually in the data should be used.
- Mark as New
- Bookmark
- Subscribe
- Mute
- RSS Feed
- Permalink
- Report Inappropriate Content
To me it sounds like the OP does not want to use the VALUESHINT option.
- Mark as New
- Bookmark
- Subscribe
- Mute
- RSS Feed
- Permalink
- Report Inappropriate Content
Thanks this seems helpful, but could you provide some instructions how to use these options since they are not documented anywhere. I attached a screenshot of the current situation (with %let maxcount=162) and the code concerning the xaxis is the following:
xaxis values=(-&maxcount. to &maxcount) refticks label="Count" integer;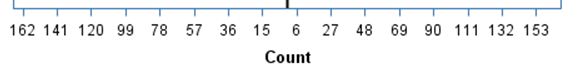
And what I would need is that the both (right and left) end points would be 162 and also that the 0 tick would always appear (now it is missing between 15 and 6). Also symmetry of the values would be a added bonus.
PS. I have modified the values with formats to show negative numbers as positive.
- Mark as New
- Bookmark
- Subscribe
- Mute
- RSS Feed
- Permalink
- Report Inappropriate Content
I think you want to use MIN= and MAX= to set the axis lengths, then specify your values with the VALUES= option.
The VALUES= list will include +/-&maxcount, 0, and some equally spaced points, like this:
/* generate some negative data */
data class;
set sashelp.class;
if mod(_N_,2) then height=-height;
run;
%let maxcount=80;
proc sgplot data=class;
scatter x=height y=weight;
xaxis min=-&maxcount max=&maxcount
values=(-&maxcount 0 &maxcount -50 to 50 by 20);
run;

- Mark as New
- Bookmark
- Subscribe
- Mute
- RSS Feed
- Permalink
- Report Inappropriate Content
Thanks for the questions and answers. Just so you all know I moved this to the SAS Statical Procedures community so folks there can find the content. It was in the general community before. Thanks, LainieH

Don't miss out on SAS Innovate - Register now for the FREE Livestream!
Can't make it to Vegas? No problem! Watch our general sessions LIVE or on-demand starting April 17th. Hear from SAS execs, best-selling author Adam Grant, Hot Ones host Sean Evans, top tech journalist Kara Swisher, AI expert Cassie Kozyrkov, and the mind-blowing dance crew iLuminate! Plus, get access to over 20 breakout sessions.
ANOVA, or Analysis Of Variance, is used to compare the averages or means of two or more populations to better understand how they differ. Watch this tutorial for more.

Find more tutorials on the SAS Users YouTube channel.
-
6 replies
-
09-17-2014 08:45 AM
-
3116 views
-
0 likes
-
4 in conversation
-
