- Home
- /
- Analytics
- /
- Stat Procs
- /
- How to analyze data expressed as CDF?
- RSS Feed
- Mark Topic as New
- Mark Topic as Read
- Float this Topic for Current User
- Bookmark
- Subscribe
- Mute
- Printer Friendly Page

- Mark as New
- Bookmark
- Subscribe
- Mute
- RSS Feed
- Permalink
- Report Inappropriate Content
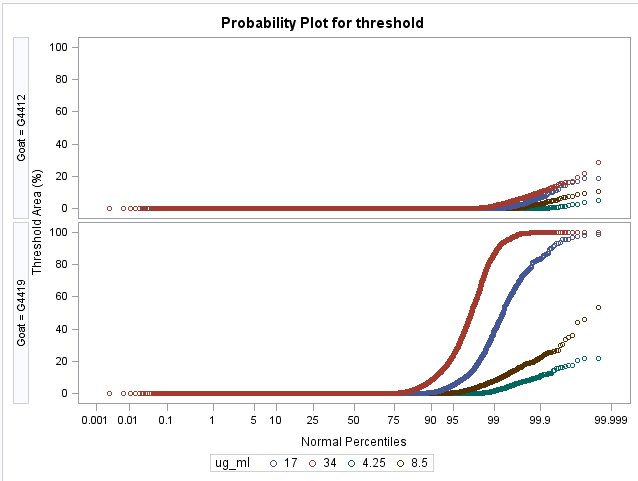
I'm trying to work out the best way to model/analyze some data. The data come from performing digital image analysis of a stained tissue on a microscope slide. The analysis uses a non-overlapping, uniform sampling window which reports the % of the window above threshold. So, for instance, each tissue slide will have recorded approximately 20,000 values. I've looked at the data using proc univariate and plotted either the cdfplot or probplot. Another way it could be looked at is with a histogram, but there are a majority of zero values so it is not as informative to look at (to me anyway). I've provided a probplot for some of the data below. As seen in the bottom panel (tissue G4419), the amount of staining (i.e., % above threshold) is related to the antibody concentration. The distribution is related to the fact that windowing areas naturally do not have equal amounts of the antibody target. IN fact, an important question is to determine at what antibody concentration are we losing important staining. So I think a first question is: can this distribution relationship with antibody concentration be modeled?
Second question: clearly the distributions are greatly different between tissue G4412 (upper) and G4419 (lower) (each representing different disease state. How do I statistically compare these? Can I compute the quantile for each that is below threshold, show a difference in proportions of data within any windowing percentage I might choose (like max, half-max, or 90-100% or 10-25%)? I keep thinking the solution might be Proc Quantreg but I'm not sure and have never implemented that. Have also wondered what constraints the type of data might have; i.e., the fact that each measure is a percentage. Is this like a survival analysis?
I look forward to learning from your suggestions.
Dave

- Mark as New
- Bookmark
- Subscribe
- Mute
- RSS Feed
- Permalink
- Report Inappropriate Content
Yum. This looks like a tasty problem (and one that I might have to be addressing soon myself with IHC data).
I think QUANTREG might be a good start. You may have to transform the percent area stained if some of the values are near zero, as QUANTREG does assume that errors are normally distributed. One of the good things about QUANTREG is that you can fit for various quantiles, and then do a test of homogeneity across quantiles.
Steve Denham
- Mark as New
- Bookmark
- Subscribe
- Mute
- RSS Feed
- Permalink
- Report Inappropriate Content
Thanks for your interest and suggestion, Steve. I'll post on this if I can make any progress or have a new insight.
Dave

Don't miss out on SAS Innovate - Register now for the FREE Livestream!
Can't make it to Vegas? No problem! Watch our general sessions LIVE or on-demand starting April 17th. Hear from SAS execs, best-selling author Adam Grant, Hot Ones host Sean Evans, top tech journalist Kara Swisher, AI expert Cassie Kozyrkov, and the mind-blowing dance crew iLuminate! Plus, get access to over 20 breakout sessions.
ANOVA, or Analysis Of Variance, is used to compare the averages or means of two or more populations to better understand how they differ. Watch this tutorial for more.

Find more tutorials on the SAS Users YouTube channel.
-
2 replies
-
01-29-2014 09:24 PM
-
1419 views
-
0 likes
-
2 in conversation
-
