- Home
- /
- Analytics
- /
- Stat Procs
- /
- How I can split character variable into multiple rows??
- RSS Feed
- Mark Topic as New
- Mark Topic as Read
- Float this Topic for Current User
- Bookmark
- Subscribe
- Mute
- Printer Friendly Page

- Mark as New
- Bookmark
- Subscribe
- Mute
- RSS Feed
- Permalink
- Report Inappropriate Content
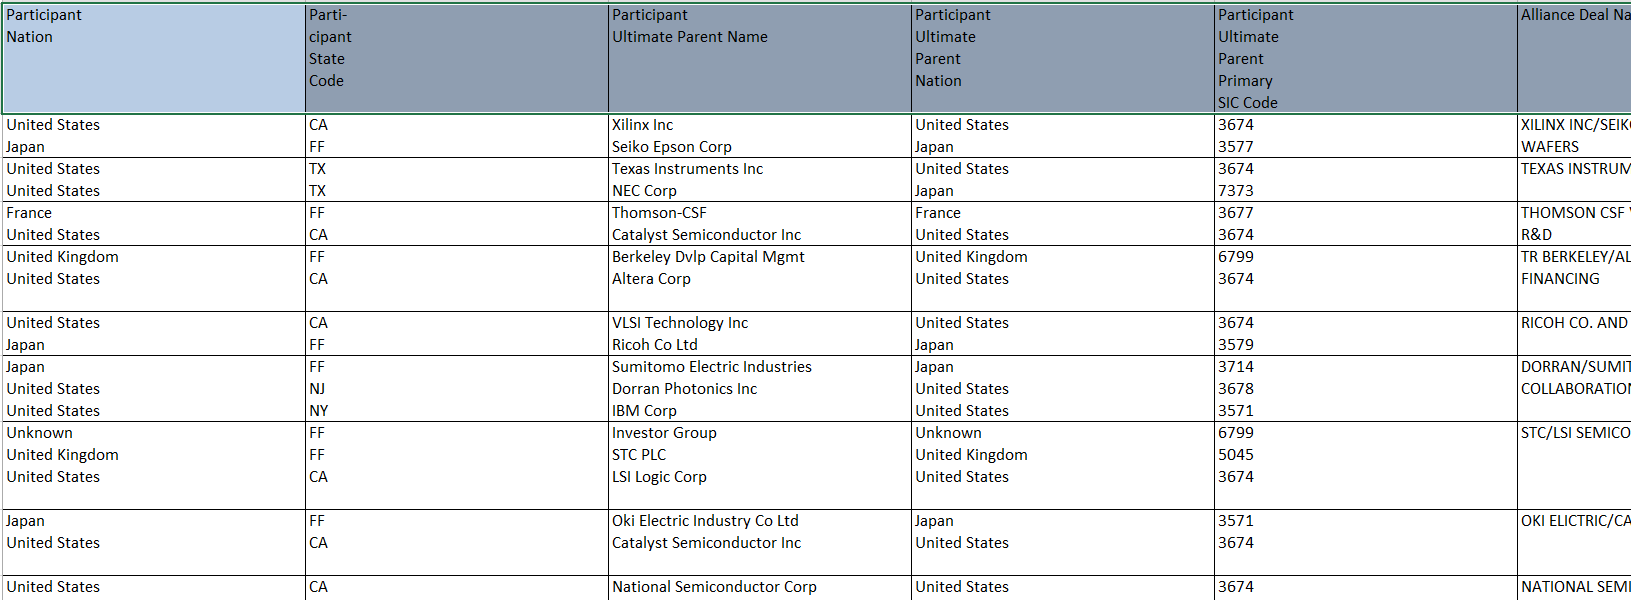
I have a dataset like this.
What I want to do it with SAS is split one blank into multiple rows
for example:
Investor Group
STL PLC
LSI Logic Corp
are in one blank
I want to split it into 3 rows
How can I do this with SAS??

- Mark as New
- Bookmark
- Subscribe
- Mute
- RSS Feed
- Permalink
- Report Inappropriate Content
Please attach a sample of your data as a .csv file.
From what I can see I would assume that the data needs to be read into SAS row by row. The values in a single cell will map as a single string into a SAS variable. I assume that this single string breaks so nicely within a cell because there are line feeds (LF) in these strings. If so then one could parse the strings and split them up into multiple observations using LF as the delimiter.
But: Looking at your screen-shot the values in the last column look like something which then would have to be repeated for all rows.
If you want us to provide a realistic solution you need to attach a sample of your real data.

- Mark as New
- Bookmark
- Subscribe
- Mute
- RSS Feed
- Permalink
- Report Inappropriate Content
Assuming your data resides in an Excel workbook, you could try something like this:
libname xl Excel "&sasforum.\Datasets\hyunjoo DATA.xlsx" access=readonly mixed=yes;
data want;
set xl.'Sheet1$'n;
array F
array F_[20] $200 _temporary_; /* 20 is >= the number of columns in the table */
do i = 1 to dim(F);
F_ = F;
end;
do j = 1 to 10; /* 10 is >= the max number of lines in a cell */
do i = 1 to dim(F);
F = scan(F_,j,'0A'x,'M');
end;
if catx(of F
end;
drop i j;
run;
libname xl clear;
proc print data=want noobs; run;
PG

Don't miss out on SAS Innovate - Register now for the FREE Livestream!
Can't make it to Vegas? No problem! Watch our general sessions LIVE or on-demand starting April 17th. Hear from SAS execs, best-selling author Adam Grant, Hot Ones host Sean Evans, top tech journalist Kara Swisher, AI expert Cassie Kozyrkov, and the mind-blowing dance crew iLuminate! Plus, get access to over 20 breakout sessions.
ANOVA, or Analysis Of Variance, is used to compare the averages or means of two or more populations to better understand how they differ. Watch this tutorial for more.

Find more tutorials on the SAS Users YouTube channel.
-
2 replies
-
09-05-2014 08:35 PM
-
2520 views
-
0 likes
-
3 in conversation
-
