- Home
- /
- Analytics
- /
- Stat Procs
- /
- Generate a spline plot in PROC GLIMMIX
- RSS Feed
- Mark Topic as New
- Mark Topic as Read
- Float this Topic for Current User
- Bookmark
- Subscribe
- Mute
- Printer Friendly Page
- Mark as New
- Bookmark
- Subscribe
- Mute
- RSS Feed
- Permalink
- Report Inappropriate Content
I am using PROC GLIMMIX to fit a generalized linear mixed model with a spline function. The model looks like:
log(Y) = random intercept + fixed intercept + beta(X1) + f(X2) + offset
I know that the EFFECT statement can create a spline function in the model, which can be written by
proc glimmix;
	class subj
	effect spl = spline(X2);
	model Y =  X1 spl / dist=poisson link=log offset=offset;
	random intercept / subject=subj type=un;
run;
However, the main problem is that there is no other statement to draw the spline plot in PROC GLIMMIX. I googled the info for a while, and most info points to the following link:
http://support.sas.com/kb/57/975.html
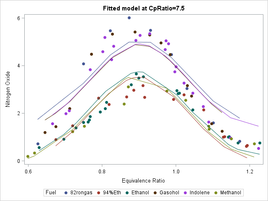
Nonetheless, the spline drawn in the example looks like a predicted spline, which y-axis is not the spline f(x) itself:
I somewhat knew that the STORE statement and the PROC PLM can generate a plot for the fitted spline, but still haven't figured out how to write the program. Any suggestion is helpful.
- Mark as New
- Bookmark
- Subscribe
- Mute
- RSS Feed
- Permalink
- Report Inappropriate Content
Do you mean that you want a plot of the basis functions for the spline? You can use the OUTDESIGN= option on the PROC GLMMIX statement to output the basis functions. See the example in the section "Write the spline basis functions to a SAS data set" of the article
- Mark as New
- Bookmark
- Subscribe
- Mute
- RSS Feed
- Permalink
- Report Inappropriate Content
Rick,
I am glad that you can reply my post in person. I did review your blog article before posting my question, but I still cannot figure out how to plot the spline function via the output data generated from OUTDESIGN option. Here is my initial program:
proc glimmix data=CVD outdesign(names)=SplineBasis;
	class IndCode Criteria;
	effect spl = spline(hour_total);
	model CVD_Sic =  Criteria spl time / dist=poisson link=log offset=log_hire s;
	random intercept / subject=IndCode s type=un;
run;
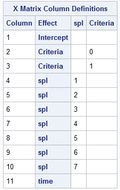
The output data set 'SplineBasis' contains several new columns named by _X1 .... _X11 and _Z1. From the X matrix column definitions table, I can know that _X4~_X10 are the values of basis from the spline. However, when opening the output data set, I still have no idea how to draw them in a spline plot because in my understanding each x has only a value of f(x). Here I provide two screenshots from my outputs:
I think I have almost reached the final step, but need a further guidance to generate the plot. I also need to draw a 95% CI of the spline. Hopefully you can advise me. Thank you.
- Mark as New
- Bookmark
- Subscribe
- Mute
- RSS Feed
- Permalink
- Report Inappropriate Content
The "ColumnNames" table shows which of the _X variables are associated with the splines. In the example below, it is _X5--_X11, but your values might be different. To see the spline bases, you need to wort the design by the underlying variable (hour_total, in your example). Here's an example that you can copy:
proc glimmix data=sashelp.cars outdesign(names)=SplineBasis;
	class Origin;
	effect spl = spline(weight);
	model mpg_city =  origin spl;
   ods select ColumnNames;
run;

proc sort data=SplineBasis
          out=SplinesOnly(keep=weight _X5--_X11);
by weight;
run;

proc sgplot data=SplinesOnly;
series x=weight y=_X5;
series x=weight y=_X6;
series x=weight y=_X7;
series x=weight y=_X8;
series x=weight y=_X9;
series x=weight y=_X10;
series x=weight y=_X11;
run;
If you don't want to use multiple SERIES statements, you can transpose the data from wide to long and use a single SERIES statement with the GROUP= option.
- Mark as New
- Bookmark
- Subscribe
- Mute
- RSS Feed
- Permalink
- Report Inappropriate Content
Rick,
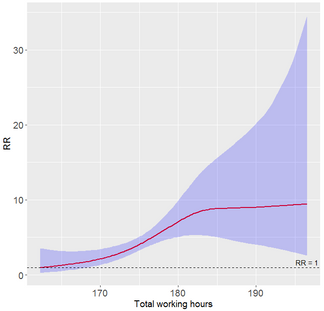
Thanks for your help, even the solution is not what I expect. Your example code generates multiple basis functions in a single plot, but what I need is just a single spline function in the plot. By using R, it looks like:
(I have transformed the estimated spline into relative risk)
I guess I can export the design matrix of the spline, and use a matrix multiplication to determine the estimated spline. However, because of the publication issue, I decide to generate this plot in R to complete my manuscript for a journal publication first. Thank you again.
- Mark as New
- Bookmark
- Subscribe
- Mute
- RSS Feed
- Permalink
- Report Inappropriate Content
I explicitly asked if you wanted a plot of the basis functions or something else. If you had posted that picture with your initial question, it would have given us something concrete to discuss and work towards.
A spline consists of a set of basis functions and parameters (or parameter estimates), so I assume the graph you show is using the estimated parameters to form the spline. You can do something similar in SAS. I know that @WarrenKuhfeld has written a lot about how to evaluate splines from their basis functions. For example, see his 2013 SGF talk:
BTW, If you want a marginal effects plot, you can use the EFFECTPLOT statement as shown in the articles:
Use the EFFECTPLOT statement to visualize regression models in SAS
Visualize multivariate regression models by slicing continuous variables
- Mark as New
- Bookmark
- Subscribe
- Mute
- RSS Feed
- Permalink
- Report Inappropriate Content
Hi,
I m also looking for a way to estimate RR from spline with proc Glimmix. Did you find a solution ?
Also, can you explain how did you do with R ?
Thanks in advance.
- Mark as New
- Bookmark
- Subscribe
- Mute
- RSS Feed
- Permalink
- Report Inappropriate Content
I still haven't figured out how to do that in GLIMMIX in these years. In R, if you use the mgcv package, you need to use the predict function to save the estimates of a spline as a new R object, and exponentiate the R object to compute the relative risks. For the other R packages, I have no idea.
- Mark as New
- Bookmark
- Subscribe
- Mute
- RSS Feed
- Permalink
- Report Inappropriate Content
ep=exp(p);
elower=exp(lower);
eupper=exp(upper);
Does ep output "odds" or " odds ratio"?
- Mark as New
- Bookmark
- Subscribe
- Mute
- RSS Feed
- Permalink
- Report Inappropriate Content
Thanks
- Mark as New
- Bookmark
- Subscribe
- Mute
- RSS Feed
- Permalink
- Report Inappropriate Content
"p" is "predicted"
- Mark as New
- Bookmark
- Subscribe
- Mute
- RSS Feed
- Permalink
- Report Inappropriate Content
proc glimmix data=simulation() method=laplace;
class strata;
  effect myspline=spline(t/knotmethod=list(1,3,5,7,9) NATURALCUBIC);
  model y(event="1")= intercept*myspline gender*t gender*myspline/dist=binary link=logit noint ;
  random strata;
  store mystore;
run;

*generate with values for t - this will be used drawing the spline;
data template;
intercept=0;
do gender=1;
  do t=0 to 10 by 0.01;
    output;
  end;
  end;
run;

*calculate the predicated values for each value of t;
proc plm restore=mystore;
  score data=template out=plot predicted=predicted lclm=lclm uclm=uclm;
run;


data plot;
  set plot;
  by t;
  *transform to oddsratio scale;
  oddsratio=exp(predicted);
  upper=exp(uclm);
  lower=exp(lclm);

'p' means 'predicted'
but how can I get odds ratio with more than one covariates- Mark as New
- Bookmark
- Subscribe
- Mute
- RSS Feed
- Permalink
- Report Inappropriate Content
Hi
you can't introduce in the same model the spline effect and the variable itself .
model y(event="1")= intercept*myspline gender*t gender*myspline
- Mark as New
- Bookmark
- Subscribe
- Mute
- RSS Feed
- Permalink
- Report Inappropriate Content
Furthermore, the spline effect includes the identity function (t) as one of the basis elements, so it is already included in the model.
Don't miss out on SAS Innovate - Register now for the FREE Livestream!
Can't make it to Vegas? No problem! Watch our general sessions LIVE or on-demand starting April 17th. Hear from SAS execs, best-selling author Adam Grant, Hot Ones host Sean Evans, top tech journalist Kara Swisher, AI expert Cassie Kozyrkov, and the mind-blowing dance crew iLuminate! Plus, get access to over 20 breakout sessions.
ANOVA, or Analysis Of Variance, is used to compare the averages or means of two or more populations to better understand how they differ. Watch this tutorial for more.
Find more tutorials on the SAS Users YouTube channel.


