- Home
- /
- Analytics
- /
- Stat Procs
- /
- Re: Comparing two curves with peaks
- RSS Feed
- Mark Topic as New
- Mark Topic as Read
- Float this Topic for Current User
- Bookmark
- Subscribe
- Mute
- Printer Friendly Page

- Mark as New
- Bookmark
- Subscribe
- Mute
- RSS Feed
- Permalink
- Report Inappropriate Content
Hello!
I have a question about analysis method and I would be very grateful for the help!
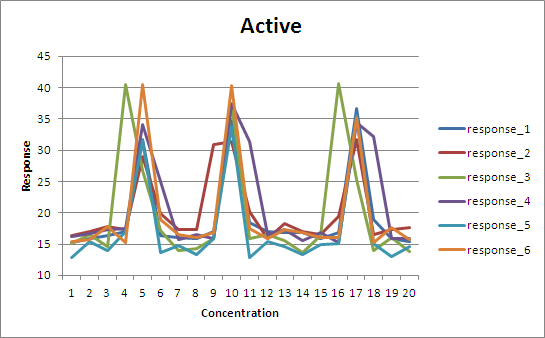
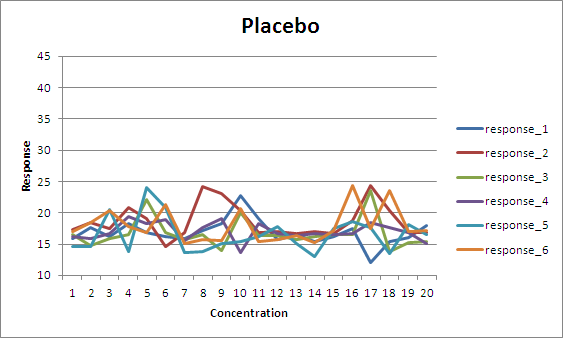
So, I have two groups: Active and Placebo, each group is measured for 20 different concentrations (from 1 to 20) 6 times (response_1 - response_6).
pic.1 Active resoults.
pic.2 Placebo resoults.
As you can see there are 3 peaks for every responses of Active group.
Do any statistical methods exist to
1) find correct concentrations of this peaks
2) prove that the peaks are not random, that it is the peaks but not the noise or some kind of outlier.
3) compare Active and Placebo groups for whole curves or particular concentrations
What analysis should I use for solve this problems?
The attached file is RAW data in .csv format with ',' as delimiter.
Best regards!

- Mark as New
- Bookmark
- Subscribe
- Mute
- RSS Feed
- Permalink
- Report Inappropriate Content
I'd like to ask two design questions. First, are the 20 concentrations blinded/masked values for some true concentration? The reason I ask is that a tri-modal response just doesn't occur very often, in my experience. However, if the 20 concentrations behind the labeled values of 1 to 20 were rearranged by increasing or decreasing true values, I would expect a pretty reasonable response curve.
Another design question: What do response_1 thru 6 represent? Are they separate samples taken at each concentration, or are they different measurements on a single sample taken at each concentration, or are they six different "subjects" measured at each of the concentrations? The proper analysis would need to recognize which of these situations apply.
With those two questions addressed, I think the analysis would be pretty straightforward for any single scenario. We just need more info to identify which scenario applies.
Steve Denham
- Mark as New
- Bookmark
- Subscribe
- Mute
- RSS Feed
- Permalink
- Report Inappropriate Content
Hi Steve! Thanks for such quick answer!
I made up data for this example and 20 concentrations are blinded values for true concentrations arranged by increasing.
About second question, in my example this is the separate samples of drugs taken at different days and by different operators, but another representation is interesting for me too.
It would be great if you suggest methods for both situations.
Cheers!

- Mark as New
- Bookmark
- Subscribe
- Mute
- RSS Feed
- Permalink
- Report Inappropriate Content
I am assuming that Steve is correct and that Concentration is actually a dummy variable rather than a true concentration such as grams per milliliter. However, I will volunteer that there are statistical techniques for determining whether a peak in density is real or whether it is an artifact. The SiZer technique of Steve Marron and his colleagues (1999-2007) was created to address this question: Introduction to SiZer

Don't miss out on SAS Innovate - Register now for the FREE Livestream!
Can't make it to Vegas? No problem! Watch our general sessions LIVE or on-demand starting April 17th. Hear from SAS execs, best-selling author Adam Grant, Hot Ones host Sean Evans, top tech journalist Kara Swisher, AI expert Cassie Kozyrkov, and the mind-blowing dance crew iLuminate! Plus, get access to over 20 breakout sessions.
ANOVA, or Analysis Of Variance, is used to compare the averages or means of two or more populations to better understand how they differ. Watch this tutorial for more.

Find more tutorials on the SAS Users YouTube channel.
-
3 replies
-
10-28-2014 09:25 AM
-
1448 views
-
3 likes
-
3 in conversation
-
