- Home
- /
- Programming
- /
- Programming
- /
- Tricky plot in SAS
- RSS Feed
- Mark Topic as New
- Mark Topic as Read
- Float this Topic for Current User
- Bookmark
- Subscribe
- Mute
- Printer Friendly Page

- Mark as New
- Bookmark
- Subscribe
- Mute
- RSS Feed
- Permalink
- Report Inappropriate Content
Data Have:
| ID | A | B | TIME |
| 1 | 56 | 12 | 0 |
| 1 | 45 | 15 | 18 |
| 2 | 34 | 17 | 0 |
| 2 | 58 | 11 | 18 |
| 3 | 44 | 23 | 0 |
| 3 | 66 | 15 | 18 |
| 4 | 87 | 21 | 0 |
| 4 | 21 | 45 | 18 |
| 5 | 11 | 65 | 0 |
| 5 | 10 | 34 | 18 |
| 6 | 32 | 66 | 0 |
| 6 | 43 | 32 | 18 |
| 7 | 78 | 66 | 0 |
| 7 | 23 | 42 | 18 |
| 8 | 88 | 33 | 0 |
| 8 | 11 | 56 | 18 |
| 9 | 78 | 22 | 0 |
| 9 | 23 | 65 | 18 |
| 10 | 65 | 11 | 0 |
| 10 | 12 | 22 | 18 |
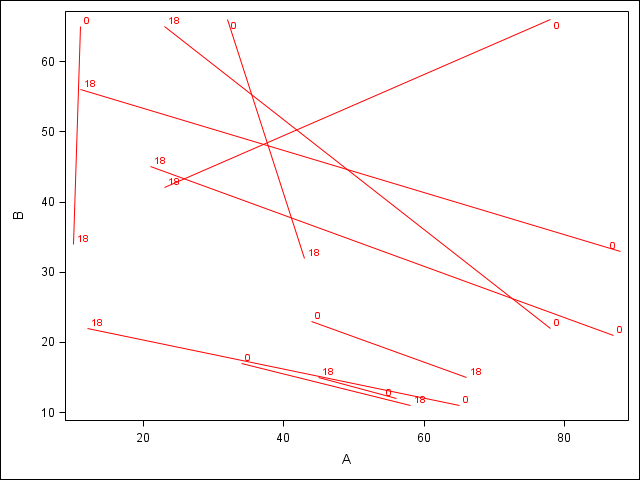
Want: Plot A*B by ID, and label time point 0 or 18 on each line connected by two points.
For example: line for ID = 1, connecting point (56, 12) and (45,15), then to label (56,12) as from time= 0, and (45,15) from time = 18.
I am stuck on the label, appreciate your great help.
Accepted Solutions

- Mark as New
- Bookmark
- Subscribe
- Mute
- RSS Feed
- Permalink
- Report Inappropriate Content
Did you consider using SG graphics?
proc sgplot data=have noautolegend;
series x=a y=b / group=id datalabel=time lineattrs=(pattern=solid color=red);
run;
PG
- Mark as New
- Bookmark
- Subscribe
- Mute
- RSS Feed
- Permalink
- Report Inappropriate Content
Did you consider using SG graphics?
proc sgplot data=have noautolegend;
series x=a y=b / group=id datalabel=time lineattrs=(pattern=solid color=red);
run;
PG
- Mark as New
- Bookmark
- Subscribe
- Mute
- RSS Feed
- Permalink
- Report Inappropriate Content
This is awesome! Thank you so much! It's working. And I will also add some star or dot data point if sgplot has this type of options. Thank you!
- Mark as New
- Bookmark
- Subscribe
- Mute
- RSS Feed
- Permalink
- Report Inappropriate Content
Yes, you can easily add markers to both ends. You could perhaps make arrows instead, if that makes sense
/* To add markers */
proc sgplot data=have noautolegend;
series x=a y=b / group=id datalabel=time lineattrs=(pattern=solid color=red)
markers markerattrs=(symbol=circlefilled color=red);
run;
/* To create arrows */
data haveWide;
retain a0 b0;
set have; by id;
if first.id then do;
a0 = a; b0 = b;
end;
if last.id then output;
run;
proc sgplot data=havewide noautolegend;
vector x=a y=b / xorigin=a0 yorigin=b0 lineattrs=(pattern=solid color=red);
run;
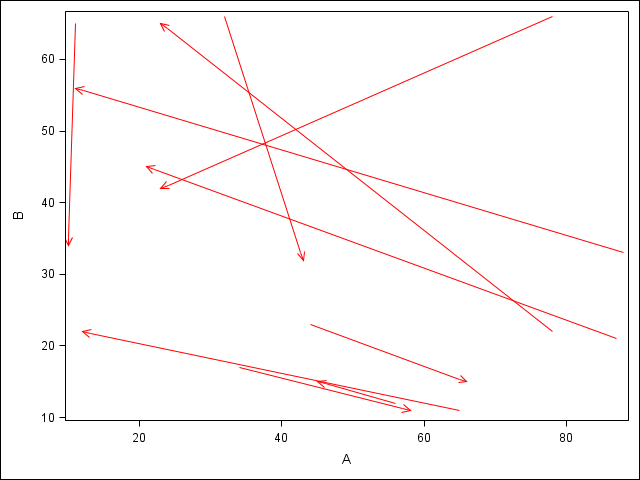
PG
- Mark as New
- Bookmark
- Subscribe
- Mute
- RSS Feed
- Permalink
- Report Inappropriate Content
You are the best!!! Thank you!
.jpg")
Catch up on SAS Innovate 2026
Nearly 200 sessions are now available on demand in the Innovate Hub.
Watch Now →Learn how use the CAT functions in SAS to join values from multiple variables into a single value.

Find more tutorials on the SAS Users YouTube channel.
SAS Training: Just a Click Away
Ready to level-up your skills? Choose your own adventure.
-
4 replies
-
11-24-2013 06:25 PM
-
2482 views
-
0 likes
-
2 in conversation
-
