- Home
- /
- Programming
- /
- SAS Procedures
- /
- how to find an asymptote from a scatter plot
- RSS Feed
- Mark Topic as New
- Mark Topic as Read
- Float this Topic for Current User
- Bookmark
- Subscribe
- Mute
- Printer Friendly Page

- Mark as New
- Bookmark
- Subscribe
- Mute
- RSS Feed
- Permalink
- Report Inappropriate Content
Hi,
I'm trying to determine the speed that a runner reaches at the end of a 3min all out effort. I have collected time and speed (at that given time) and when plotted on a scatter plot, it looks like it goes to an asymptote. Is there a procedure in SAS that can determine that asymptote speed? I wanted to use PROC NLIN but I don't know the function so I looked into PROC TRANSREG and the spline sometimes gives me the asymptote but sometimes it curves up at the end... Theoretically, it should be a smooth exponential decay or inverse curse from time zero to time (>3min).
here are my data...
| time(s) | speed (m/s) |
| 7.8 | 6.41 |
| 11.46 | 6.83 |
| 15.11 | 6.85 |
| 31.4 | 6.37 |
| 34.9 | 7.14 |
| 39 | 6.10 |
| 43.78 | 5.23 |
| 48.14 | 5.73 |
| 52.77 | 5.40 |
| 57.8 | 4.97 |
| 62.3 | 5.56 |
| 67.1 | 5.21 |
| 72.2 | 4.90 |
| 76.6 | 5.68 |
| 81.4 | 5.21 |
| 87.75 | 3.94 |
| 92.89 | 4.86 |
| 98.05 | 4.84 |
| 103.8 | 4.35 |
| 109.1 | 4.72 |
| 114.3 | 4.81 |
| 119.9 | 4.46 |
| 124.8 | 5.10 |
| 130.2 | 4.63 |
| 136.6 | 3.91 |
| 142 | 4.63 |
| 147.71 | 4.38 |
| 153.2 | 4.55 |
| 158.7 | 4.55 |
| 164.3 | 4.46 |
| 169.9 | 4.46 |
| 175.1 | 4.81 |
| 180.4 | 4.72 |
any help will be great!
thanks!
ming
Accepted Solutions

- Mark as New
- Bookmark
- Subscribe
- Mute
- RSS Feed
- Permalink
- Report Inappropriate Content
Try
proc nlin data=test;
parms Vo=2.5 a=-0.017 Vf=4.5;
model speed = Vo*exp(a*seconds) + Vf;
output out=outTest predicted=predSpeed;
run;
proc sgplot data=outTest noautolegend;
series x=seconds y=predSpeed;
scatter x=seconds y=speed;
yaxis min=0;
run;
Initial speed is Vo + Vf. Asymptotic speed is Vf.
Approx Approximate 95% Confidence
Parameter Estimate Std Error Limits
Vo 3.1430 0.3154 2.4989 3.7870
a -0.0176 0.00493 -0.0277 -0.00751
Vf 4.2795 0.2463 3.7765 4.7826
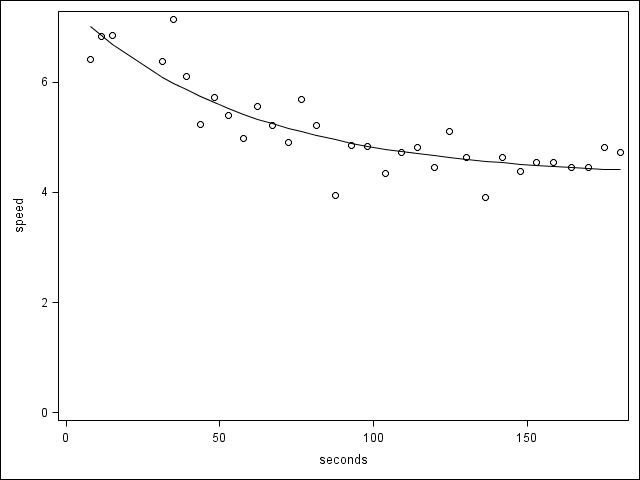
Seems to fit well...
PG
- Mark as New
- Bookmark
- Subscribe
- Mute
- RSS Feed
- Permalink
- Report Inappropriate Content
Try
proc nlin data=test;
parms Vo=2.5 a=-0.017 Vf=4.5;
model speed = Vo*exp(a*seconds) + Vf;
output out=outTest predicted=predSpeed;
run;
proc sgplot data=outTest noautolegend;
series x=seconds y=predSpeed;
scatter x=seconds y=speed;
yaxis min=0;
run;
Initial speed is Vo + Vf. Asymptotic speed is Vf.
Approx Approximate 95% Confidence
Parameter Estimate Std Error Limits
Vo 3.1430 0.3154 2.4989 3.7870
a -0.0176 0.00493 -0.0277 -0.00751
Vf 4.2795 0.2463 3.7765 4.7826
Seems to fit well...
PG
- Mark as New
- Bookmark
- Subscribe
- Mute
- RSS Feed
- Permalink
- Report Inappropriate Content
thanks for your help!
I tried it on another set of data with 4 data points, it didn't fit as well, but if I play around with the starting points for Vo, a, and Vf... sometimes I can get it to converge.
ming
- Mark as New
- Bookmark
- Subscribe
- Mute
- RSS Feed
- Permalink
- Report Inappropriate Content
Fitting a 3-parameter curve on 4 points doesn't give much freedom!
Given times T1-T4 and speeds S1-S4, you can try :
Vo=S1-S4, Vf=S4, a=-1.4/(T2+T3)
as starting values.
Good luck!
PG

Don't miss out on SAS Innovate - Register now for the FREE Livestream!
Can't make it to Vegas? No problem! Watch our general sessions LIVE or on-demand starting April 17th. Hear from SAS execs, best-selling author Adam Grant, Hot Ones host Sean Evans, top tech journalist Kara Swisher, AI expert Cassie Kozyrkov, and the mind-blowing dance crew iLuminate! Plus, get access to over 20 breakout sessions.
Learn the difference between classical and Bayesian statistical approaches and see a few PROC examples to perform Bayesian analysis in this video.

Find more tutorials on the SAS Users YouTube channel.
 Click image to register for webinar
Classroom Training Available!
Select SAS Training centers are offering in-person courses. View upcoming courses for:
-
3 replies
-
08-01-2013 12:52 PM
-
1984 views
-
0 likes
-
2 in conversation
-
